Training and working with university students has been a core part of the Ramani Huria project since it started in 2015. Since then, we have trained over 1,000 university students in industrial placements, equipping them with the valuable open geospatial skills they can use in their careers. While training students, we have also been able to collect a variety of datasets to support urban resilience programs, particularly flood preparedness in Dar es Salaam.
Over these past five years, we have improved our skills-sharing with students. This not only enables reliable and cost-effective data acquisition thanks to their work, but it also exposes them to new ways of doing things without investing a lot of money on expensive equipment. For example, we familiarize students with accessible open tools and software that they can use beyond their industrial placement.
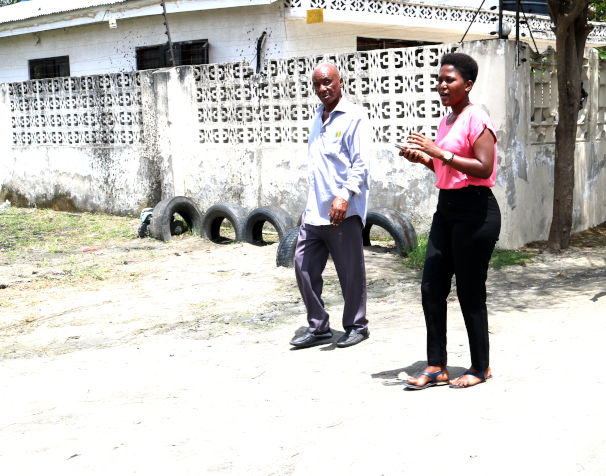
Deploying students in the field
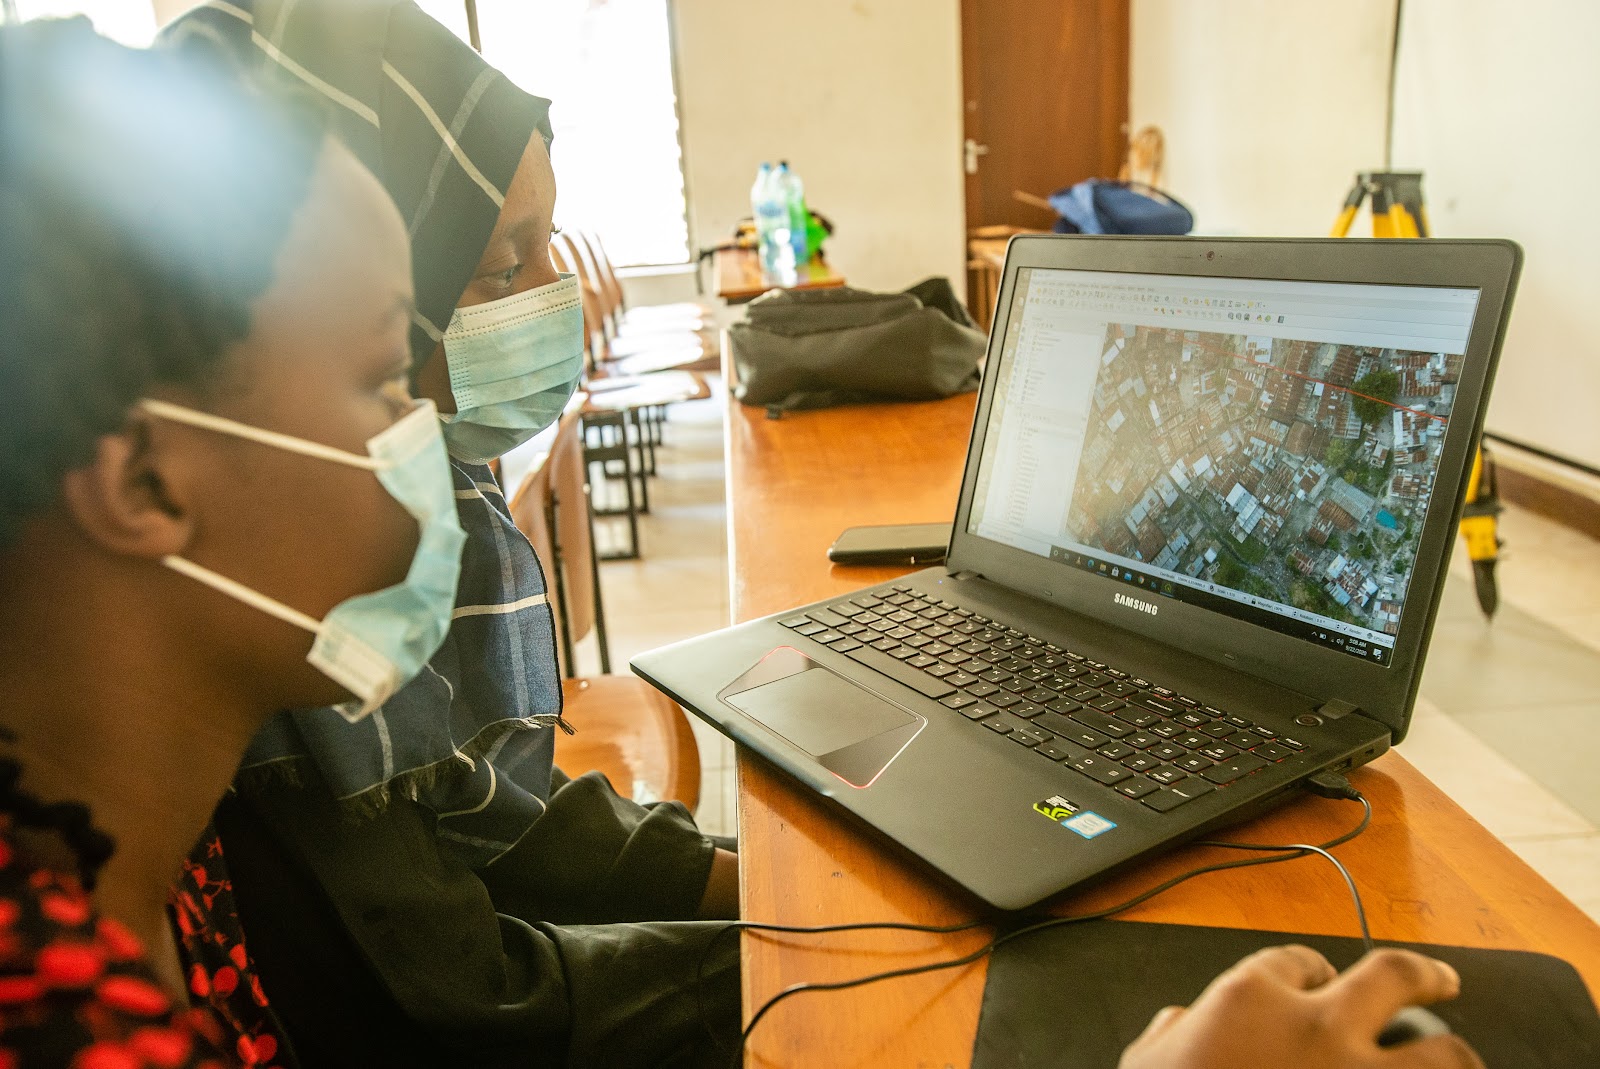
Working with the Tanzania Resilience Academy to train 200 university students from three universities between September and November 2020, we were able to give them field mapping experience while collecting flood-extent data in flood-prone areas in Dar es Salaam.
In the past two months, students were able to work with community members from 20 wards in Dar es Salaam to collect data on the extent and depth of water when it floods. The data collected will build upon the already existing data from our river cross-section survey to further develop the city flood model to help predict and prepare for future flooding.
One of our goals is exposing students to the latest open-source geospatial technologies and innovations. We gave a small team a low-cost dual-frequency (u-blox) receiver that they used to collect ground control points using the precise point positioning (PPP) technique, providing data with a high level of position accuracy that could be used for rectifying drone imagery. This work created the data we required for these catchment areas while also equipping students with skills in using low-cost equipment that is readily available.
As it is a fundamental skill for any newcomers to the geospatial world, we also trained students in digitizing building footprints using JOSM software. The students then updated the already digitized buildings in Dar es Salaam using up-to-date high-resolution, 2020 Maxar imagery with 50 cm accuracy.
“Many companies and organizations need spatial skills that meet their business or industrial needs. The skills I gained as a student may pave the way to different opportunities that will require digital geospatial skills” – Batuly Lukonge, Student, UDSM.
Digitization of Buildings, Photo: Chris Morgan, World Bank
Call for Action
We advise organizations and startups that are eager to equip youth with relevant industrial and technical skills to work directly with students and engage them in real-world projects. This supports them academically and creates a cohort of youth that are problem solvers and ready to take part in this technologically advancing world. It also makes them marketable in the 21st Century, supporting them in competing for opportunities around the world.
Community generated data has proven to be the most reliable information that reflects the community’s situation and the challenges they face. Working with community members to collect data in their own neighborhood increases data reliability, validity and its ultimate use as the community believes in the data and has a sense of ownership.
As we explained in one of our earlier posts Mwanza City is rapidly urbanizing with a lot of its growth concentrated in unplanned areas with approximately 81 percent of households situated in hazard-prone areas. Community knowledge was key to understanding the extent of these problems. For this reason, the consortium trained the students and communities on how to use cheap and widely available tools, such as mobile phones, GPS units, and satellite imagery to collect data on urban risks stemming from flooding and rockfalls.
Data Collected
Using a mixed-method approach consisting of digitizing the satellite imagery, mobile and GPS field data collection, community consultations, and stakeholder meetings, we were able to collect:
More than 300,000 buildings using satellite imagery
More than 15,000 points on flood-prone areas using mobile phones
More than 800 point on rockfall-prone areas using mobile phones
More than 80,000 points on urban exposure using mobile phones, and
At the moment of this writing 1700 drain segments with 145.013km
of drainage lines and 4300 drainage related points of interest have been mapped using a combination of mobile phones and DIY RTK units.
Areas at risk for rockfall
Insights from community members and leaders
Below are some of the quotes taken directly from community members and leaders who were directly involved in the process of data collection
“The data helps me as a community leader to represent the challenges with evidence to the higher authorities, I will especially like drainage data to be collected as it will show the real situation of the narrow drains in our subward.” Juma Kasudi, Mjumbe – Mwinuko subward
“The collected data will help in the warning system, enabling the communities to at least evacuate before flooding. We can also present the flooding issue to the district council as we have datasets that explain the whole situation. It’s now our duty as community leaders to educate our community that the data does not lead to house demolition or relocation but rather finding solutions”. Joseph Chui, Mjumbe – Kitangiri
“Kitangiri is one of the severely affected wards by floods and rockfalls. Schools are also affected, making me worried as a leader that one day students may get hurt or even die. I hope the data can reach the right actors and lead to the construction of permanent structures especially drainage systems”. Robert Charles, Chairman – Kitangiri A subward.
Outcomes of our engagement
Capacity building to 79 university students – final year students will use the same software in their research and dissertations as it has proved to be a more cost-effective way of gathering data
Requests from the university lecturers to teach more about open-source tools used in data collection
Raising awareness to community members and local leaders on the importance of data use in making decisions
Field data collection, Photo: Primoz Kovacic, Spatial Collective
Challenges during data collection
Nature of the terrain and accessibility; Mwanza is characterized by highly dissected steep slopes and rocky hills making it more difficult for mappers to collect data especially in the slums
Misinterpretation of the project; communities believed that the mapping will lead to the demolition of their houses and possible relocation. The mappers had to carefully and mindfully explain the goals of the project and that the project is not in any way connected to relocation
Political issues; the general election posed some challenges to obtaining permissions on time
What is next?
After the mapping and curation of all datasets, we expect to hold a workshop with the potential data users to ensure they have the ability to access and use these data for informed decision making. The workshop will involve key stakeholders like community leaders, road agency authorities, regional disaster departments, etc.
Community Mapping for Urban Risk in Mwanza, Tanzania
Photo: Primoz Kovacic
Mwanza is the second-largest city in Tanzania with a population of about 1.2 million. Located on the shores of Lake Victoria, it is characterized by highly dissected steep slopes, rock hills, narrow interfluves, and river valleys.
Like other towns in Tanzania, Mwanza has undergone a massive spatial expansion in recent years. According to Macrotrends, the population in Mwanza increased by 5.56 percent since 2019, with a lot of its growth concentrated in unplanned areas. Further, approximately 81 percent of households situated in hazard-prone areas fall in the low-income population bracket. These areas often lack access to adequate municipal services such as water, sanitation, solid waste, electricity, and drainage. These shortcomings, together with acute, periodic flooding, contribute to a deteriorating environment which often leads to an increase in health and safety risks.
Building on the previous projects of Ramani Huria and Zanzibar Mapping, Spatial Collective, Humanitarian OpenStreetMap Team, and OpenMap Development Tanzania recently extended their operations to Mwanza City. Under the banner of the Tanzania Urban Resilience Program (TURP), the aim of Community Mapping of Urban Risks in Mwanza is to produce high-quality, ground truth spatial information and urban risks data for selected wards in Ilemela and Nyamagana municipalities.
The consortium will achieve this by focusing on 4 core mapping campaigns:
By utilizing the rectified aerial and satellite imagery, we will produce digitized foot/roof prints of buildings as well as road and street networks suitable for OpenStreetMap.
Through drainage infrastructure and river mapping, we will produce datasets of critical drainage infrastructure including condition surveys of drains, culverts, and urban rivers.
Through the participatory mapping of unplanned communities, we will collect data on critical infrastructures, such as health facilities, access routes, government installations, safe spots, open spaces, businesses, schools, religious institutions, and any other relevant public amenity.
Through household flood and rockfall historical incidents mapping, we will collect and analyze data on flood and rockfall histories.
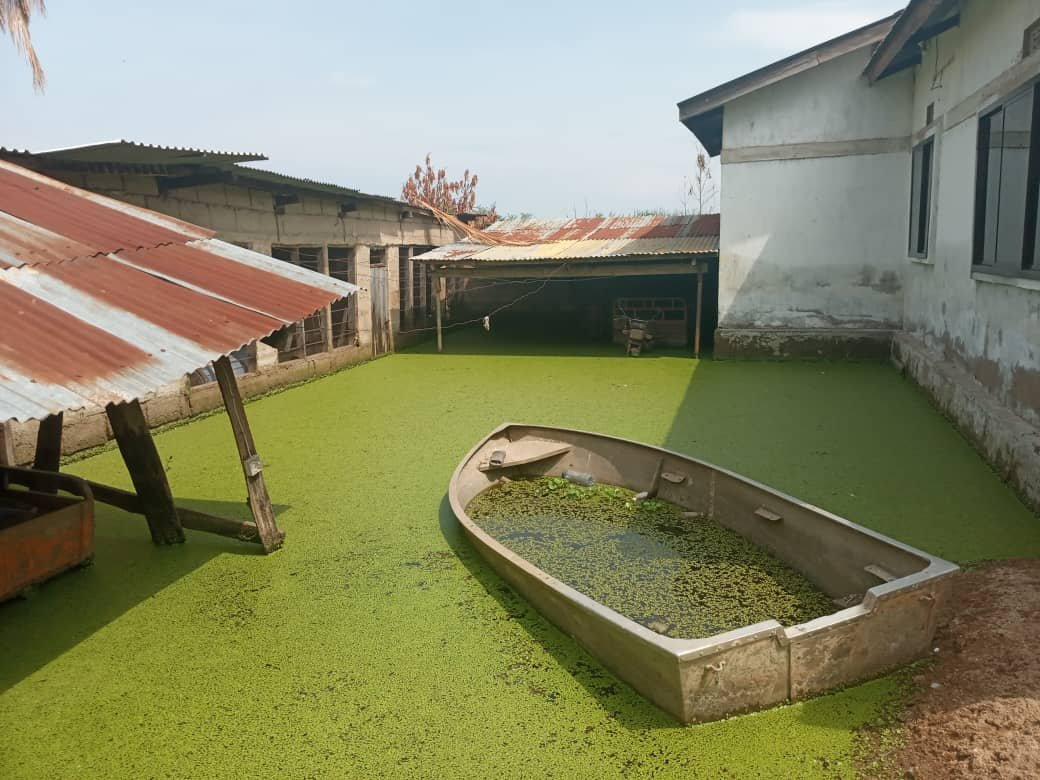
Flooding in Mwanza. Photo: Ester Daniel
All four mapping campaigns will be carried out in collaboration with the Institute of Rural Development Planning, St. Augustine University of Tanzania, and government officials in selected municipalities. Furthermore, the assignment will include training of government surveyors from the Ministry of Land’s lake zone office, Ilemela and Nyamangana municipal councils, Tanzania Rural, and Urban Road Authority (TARURA), and Lake Victoria Basin Water Board (LVBWB).
The project will both transfer knowledge on community mapping to stakeholders and provide authorities and communities with data to inform urban planning and hazard-preparedness in Mwanza city.
This blog is co-written by Spatial Collective and OpenMap Development Tanzania
Since 2019, the Resilience Academy has been supporting students’ industrial training—an internship program that normally goes up to eight weeks. The aim is to support students participating in practical activities and increase their skills especially digital skills. Resilience Academy is a partnership between four academic institutions in Tanzania: Ardhi University (ARU), University of Dar es Salaam (UDSM), Sokoine University of Agriculture (SUA), and State University of Zanzibar (SUZA) with the University of Turku (UTU) from Finland.
The skills that students will acquire include mobile data collection using OpenData Kit (ODK)—an open-source software for collecting, managing, and using data in resource-constrained environments—, field and community mapping, map production using QGIS, data quality assurance, all while contributing to OpenStreetMap.
The series of industrial training over the years has been successful in creating an apprenticeship program for more than 800 students (as of 2019) before and after college graduation. Over the past years, we have had students who benefited from the Ramani Huria project, who are now flying across the world to teach and present about our work and how the use of open-source software has served as a tool to support them to develop their skills.
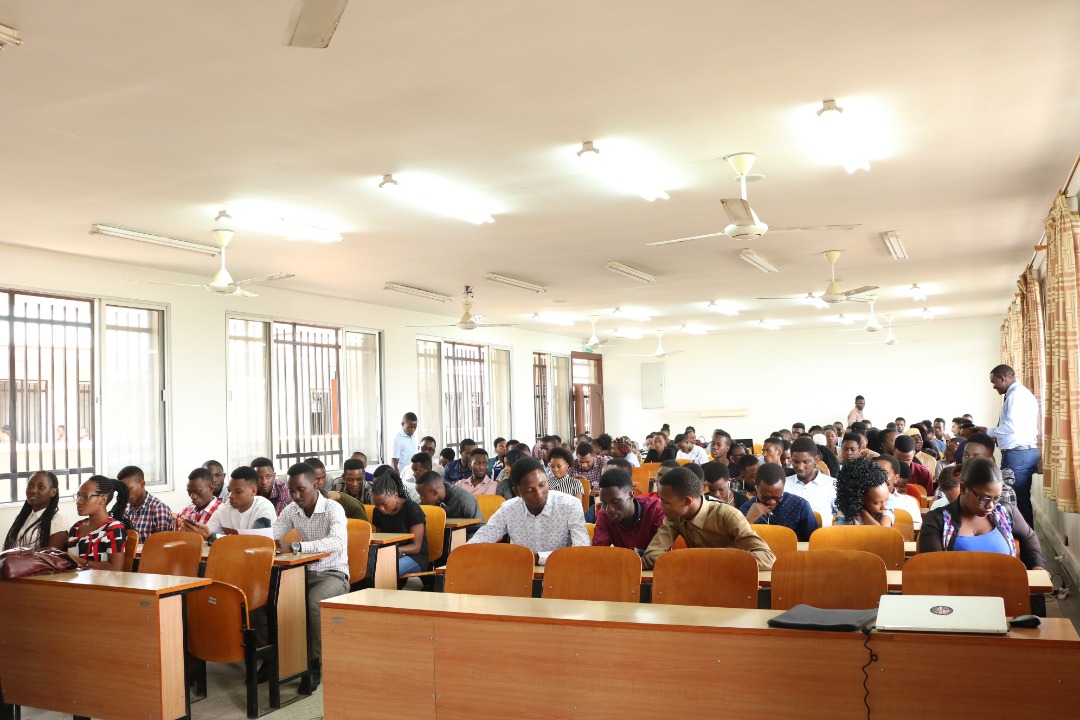
Training Session
The first week of the training basically focused on bringing students on board on what to expect from the 6 weeks placement and what is expected from them . Introducing OpenStreetMap, QGIS, ODK for data collection, and the importance and value of community engagement, in general, were the main topics featured in the first week. The students got to learn:
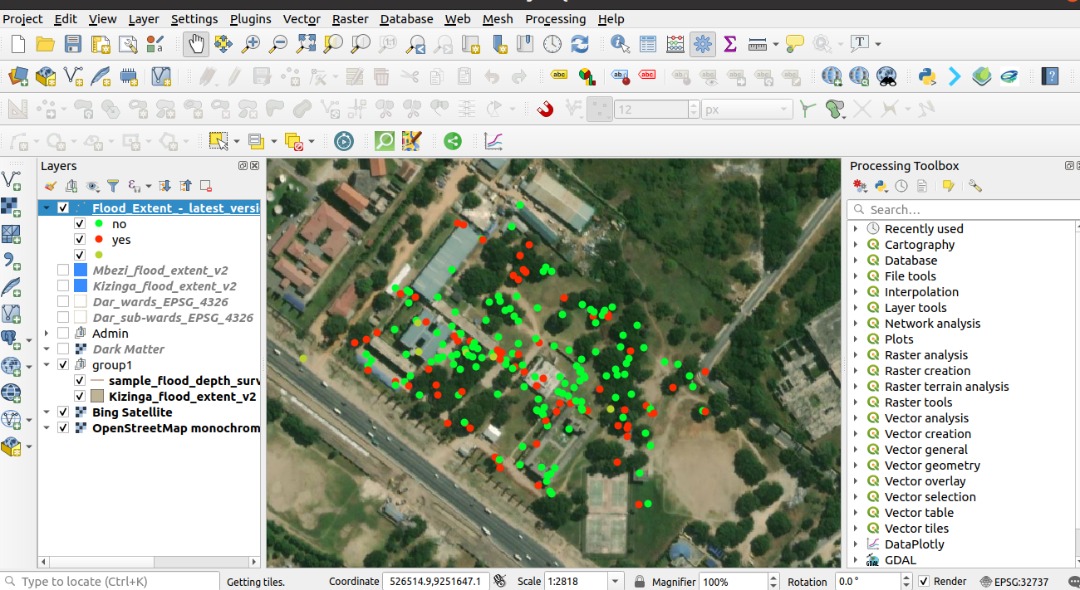
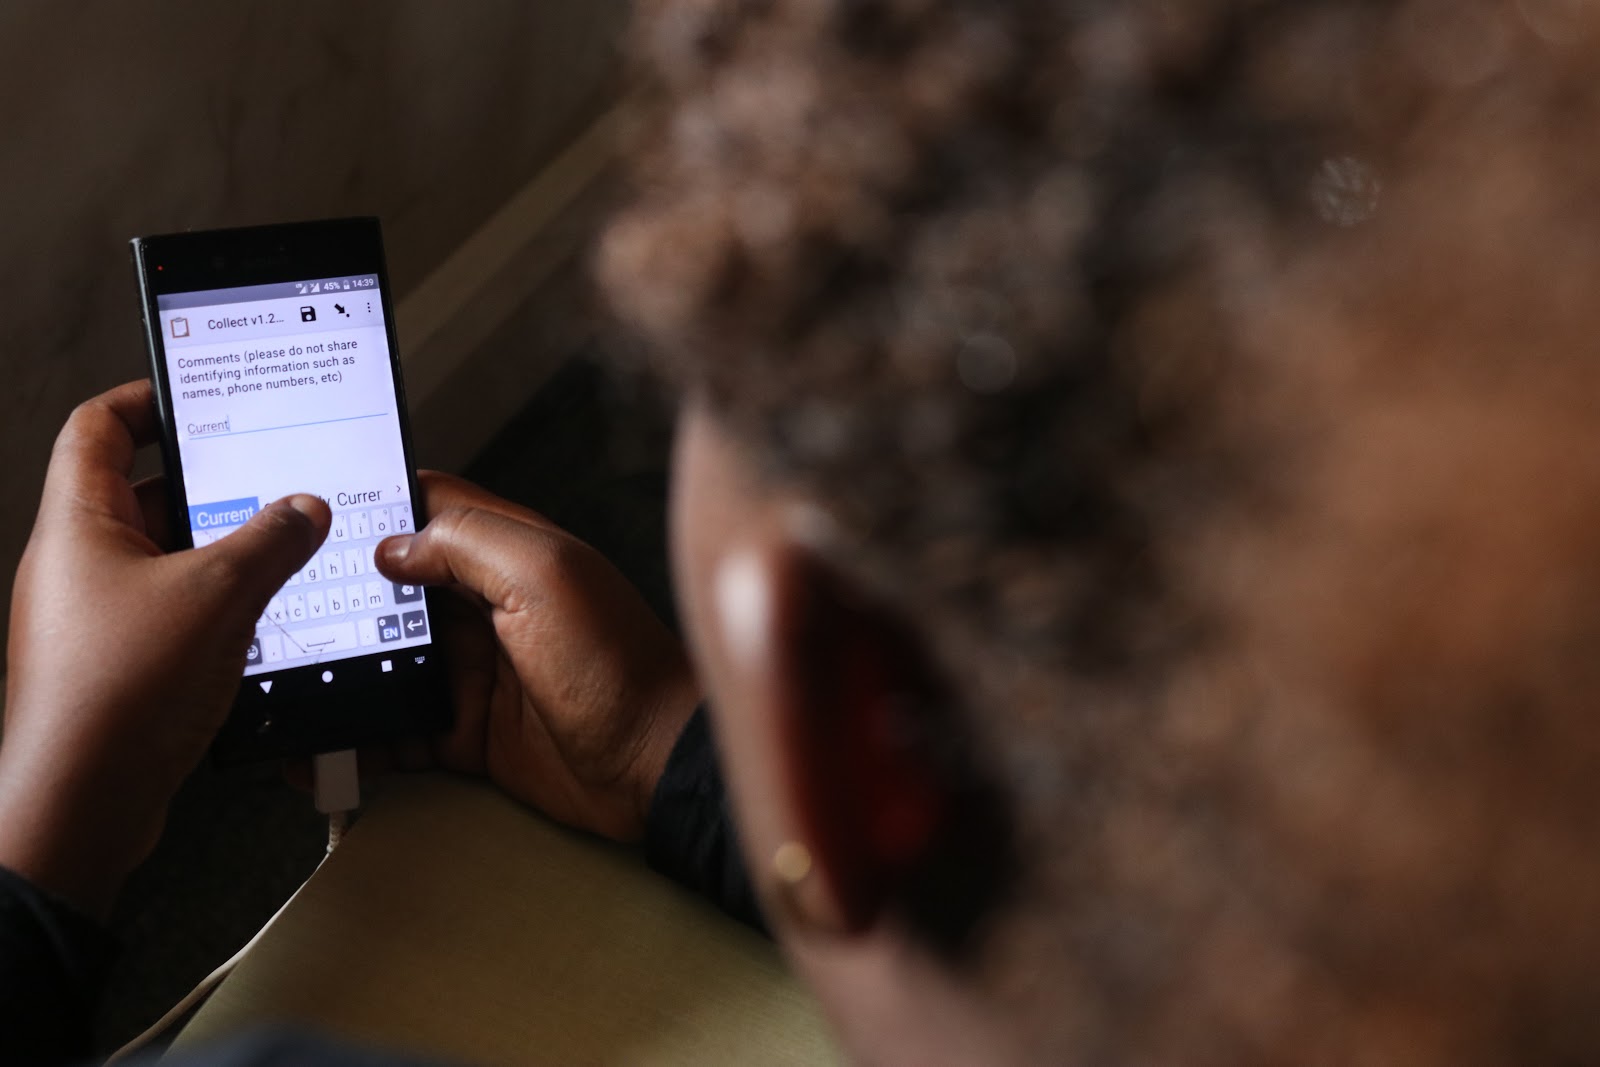
Basics of ODK and how the application works in the field. They had an opportunity to collect some points around the university campus, just to make sure they got a hang of it. We then visualized the points collected on QGIS for them to see how the process works and how the data they will be collecting in the field will be visualized.
Sample data points collected by students visualized in QGIS
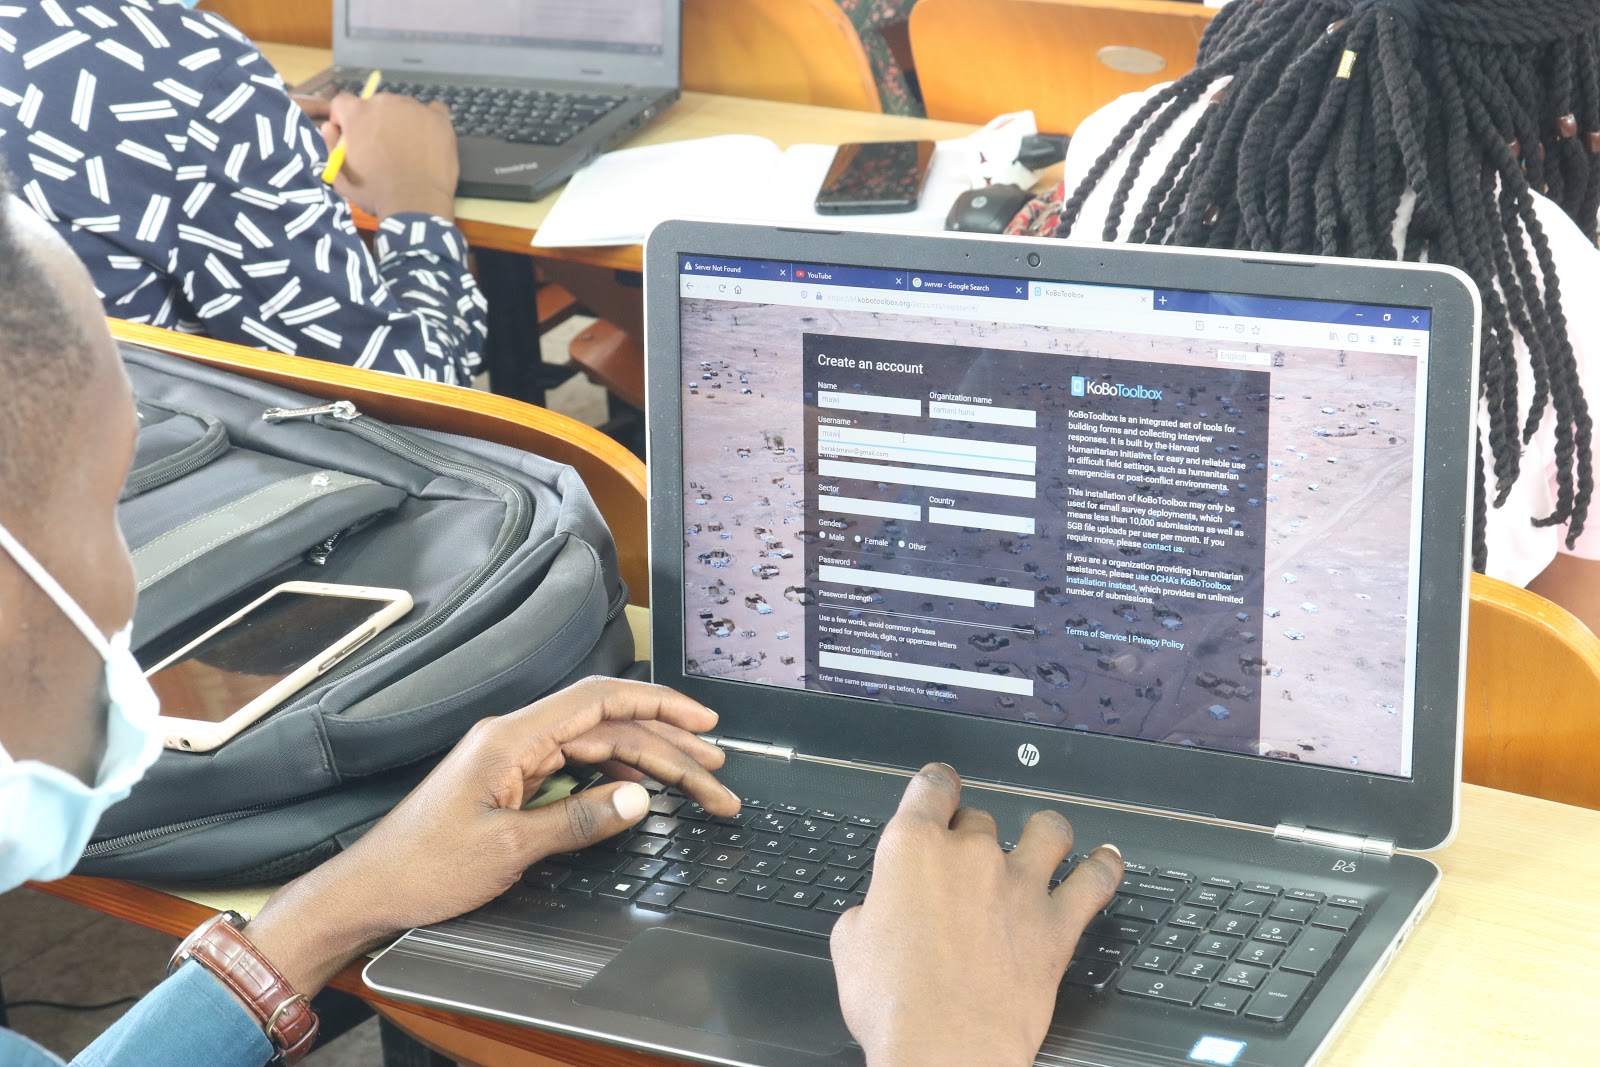
XLS Form and KoboToolbox server creation. It is very important for students to understand the infrastructure behind the surveys they will conduct in the field. Helping the students see how applications work in the backend to produce what they see in the frontend increases their passion and appreciation of what they are doing. Students created their own KoboToolbox accounts and learned how to create forms and deploy them on the server. This will equip them with the necessary skills that will help them beyond industrial training especially for those doing their dissertations and research; this can be the leap from field papers to digital data collection we have always been hoping for.
Student creating a KoboToolbox server account
Introduction to drone imagery for mapping and how important it is to have these images while mapping for floods. This was demonstrated to the students visually with a drone video prepared by one of our supervisors to inspire students who want to gain more skills in drones.
The importance of community engagement while mapping and how to conduct/collect household surveys.
What we expect from students
At the end of this training, we expect students to have a better understanding of the strength of maps acting as a tool for urban resilience and how the data collected can be analyzed, visualized, and used for decision-making in the long run. Students will work on the following:
Flood extent mapping: Conducting household surveys on the extent of flooding in different predetermined areas by interviewing community members living in these areas with questions like the depth of flooding and how often the flood occurs. This data will help in the development of a flood model. Since flooding is a very sensitive issue especially to communities that are being affected, the communities may be reluctant to cooperate with beliefs that their houses may be demolished. In order to overcome this hurdle, we train students to clearly explain the goal of the project and that it does not aim to relocate them, but rather provide relevant data to decision-makers which will result in infrastructure development in their communities.
Ground control points for UAV surveys: As an extension of the Ramani Huria 2.0, an additional targeted 100 GCPs will be collected by students from these universities in three rivers; Msimbazi, Mlalakuwa, and Mbezi rivers which will be processed for rectifying drone imageries.
Building footprints digitization: Most buildings within the city have already been digitized using a high-resolution raster background, however, this is from 2016 imagery. Students will use Maxar imagery (with 50cm accuracy) to re-digitize Dar es Salaam to provide building exposure data. The focus of the updated digitization will be on peri-urban areas where a high rate of change versus the situation in 2016 is expected. Inner city and other already densely populated areas will only receive cursory checking and validation, and will not be updated at the individual building level.
Tree mapping: This will involve measuring the height of the tree diameter at breast height (DBH), identifying tree species which can also be identified using tree leaves, bark, roots – A botanist will help to identify the species in SUA. At Dar es Salaam, students will be mapping trees along the River Ng’ombe that is being upgraded to get a baseline tree database.
Data quality and validation: After data collection, few students will be trained on data quality assurance. They will conduct quality checks to make sure that data is of the desired standard.
A student learning how to use ODK for Data Collection
Insights from Students
Students are generally motivated and eager to learn more in the coming weeks. According to the students, they didn’t know that their mobile phones could be used for anything other than just normal communication. They shared their minds with us:
“Our mobile phones are much more than just texting and calling, I didn’t know I can use my phone for mapping. I’m really looking forward to learning more, especially field mapping and GIS applications”. Zulfa Said, Student – UDSM
“What I like more about this project is the involvement of community members, and this is what brings changes in our society “- Jackson Pilla, Student, SUA.
On 29th July 2019, the Ramani Huria (RH) summer industrial training project entered a new era of management and administration, shifting from the direct management by the Humanitarian OpenStreetMap Team (HOT) to being managed by universities, i.e. University of Dar es Salaam (UDSM), Ardhi University (ARU) and the State University of Zanzibar (SUZA) as the Tanzania Resilience Academy (RA).
The RA has established cooperation between Tanzanian universities and the University of Turku in Finland together with national and international actors interested in working on urban resilience and flooding issues. Through the RA, multiple research teams, public and private sectors, NGOs and the general public come together to solve challenges of flooding with diverse digital datasets, tools, and solutions.
Just as it was done before, the Resilience Academy will focus on capacitating university students to be able to learn by doing and participating in real projects such as the collection of digital datasets, the only difference being that it will not be a stand-alone project, but a consortium of many other partners interested in the resilience program.
Since its establishment in 2015, Ramani Huria has picked up the pace and gained the reputation of becoming the largest community mapping initiative in Africa, training over 800 students working with over 6000 community members on open community mapping, mobile data collection, the power of mapping, and how it can serve as a tool for disaster planning and management.
By helping communities to map residential areas, roads, streams, floodplains, and other relevant features, the project has brought and will continue bringing disaster prevention and response to areas that were not visible on a map—considering that the city is unplanned and some neighbourhood construction is increasing at 20% per year. The data are being used by disaster emergency response programs and organizations such as RedCross and Dar es Salaam Multi-Agency Emergency Response Team (DarMAERT)
The project also builds awareness of the need for flood prevention and risk reduction to the local level, while teaching participants valuable computer and mapping skills that they can put to use elsewhere.
The Training
As the project is a new experience to the coordinators of the Resilience Academy, HOT is supporting the coordination in terms of organizing and training students. In this year’s industrial training, only 150 students were allocated to the program which is in contrast to last year where we had more than 600 students during the summer RH scale-up. The main reason to have fewer students is to be able to manage students properly as it is a new experience for the RA.
This number of students gives room for supervisors to provide intensive training and close follow-up on the materials disseminated together with practice in the field.
Students have their expectations from the project and the industrial training. One of the students interviewed had this to say:
‘My expectations during this training are to improve my academic career but also learn how to support my community when I graduate, especially fighting disasters like flooding. I’m specializing in drainage mapping–collecting datasets which will help us understand the flow of water in the city and support different initiatives focusing on flood reduction, by giving them reliable data’. He added ‘In general I would like to congratulate the Ramani Huria project for their amazing work in trying to help communities affected by flooding, I call for everyone out there to support the project for the present and future generations’. Humphrey Mrema–first year student, Urban and Regional Planning
Students are from different fields of study including Urban and Regional Planning, Housing and Infrastructure Planning, Regional Development Planning, Geography and Environment Studies, Computer Science, Computer Engineering and Information Technology, and Telecommunication Engineering, which will create a diverse range of expertise and the learning will be beneficial to all students and the future of the Resilience Academy.
‘This year’s industrial training, a different training is being conducted, I will specifically work with computer science students and see how we can integrate geospatial data and ICT–there is a big gap between these two fields and they have been seen as two separate independent blocks. But with the changing technology and seeing the bigger picture, there is a need to integrate them. For example, we are doing data collection, how are we going to develop tools? How are we going to automate the data cleaning process? i.e Python, scripting the tools we use in data collection, visualization, etc. one needs to have an understanding of both GIS and ICT’–Iddy Chazua, GIS and Tech lead-HOT/OMDTZ.
For the last three years, students have only been directly involved in data collection while a few did data cleaning and map production. In this phase, however, the training will be more advanced and students will be trained in a number of areas including:
Community mapping and mobile data collection: Using mobile phone applications for data collection such as OpenDataKit (ODK) Collect and OpenMapKit (OMK) and working with community members who support in the collection of information and produce an enormous amount of datasets.
Drainage mapping: Mapping drainage systems in the most flood-prone areas across Dar es Salaam using cheap and practical methods, and cleaning them in the Hydro OSM model. This data will later be used to produce a flood model of the city, early warning systems, and support in risk management and planning.
Data processing: The Geospatial Data Abstraction Library (GDAL) will be used for batch compression and conversion of the high-resolution imagery to Mbtiles to be used in data collection tools, i.e. ODK and OMK and desktop software (QGIS and JOSM). QGIS will also be used to monitor the daily quality of data by partial visualization as the data are collected and visualized for the final product.
Data management: This will be covered using PostgreSQL server with PostGIS extension installed locally for sharing data using Local Area Network (LAN) to avoid clipping and merging when sharing the data which may result in data loss and errors. The same setup will also be configured in a remote host, i.e. Digital Ocean, which will be potentially used for data storage and sharing among the teams throughout the industrial training.
XLS form creation: Creating ODK surveys to equip students with the necessary skills and not spoon-feeding them by only giving them pre-developed surveys to use in the field. This involves training them on how they can export collected data from the field and make initial checks on Excel.
Data manipulation and automation: Students will use the Python program to develop intelligent scripts and add automation to data cleaning used after data collection. They will be taught the fundamentals of Python as well as implementing their scripts practically to clean CSVs with ODK form responses from the community mapping activities of the industrial training. Additionally, they will learn GDAL bash scripting to automate image processing and scripts in SQL for manipulating data in PostgreSQL.
For smooth training and data collection, students have been divided into six major groups of specialization. I.e Flood extent mapping, Drone development, Drainage mapping, Computer Science, Assets and Threats mapping and Data cleaning group.
What is Next for Ramani Huria?–The Legacy of Ramani Huria
The second phase of Ramani Huria will end this year, however, the legacy of the project will still surface on different levels, from institutions to government to students who benefited from the project and many other fields. The legacy of the project can be explained in two major blocks:
Intangible Impacts:
Creating an apprenticeship system to students supporting them learn by doing i.e students participating in real project activities in the field. Through this system, a number of graduates who participated in the project are now implementing different projects and have technical and managerial capacities to run even bigger projects in the future.
The knowledge gained by students and community members throughout the implementation of the project. As we have mentioned earlier, more than 1000 students and about 300 community members have been involved in the project. The knowledge gained will increase the use of datasets produced and contribute to city resilience with a strong, young, and enthusiastic community that believes in data-driven policies and decisions.
Ramani Huria becomes a community-mapping model to other African countries and worldwide: Other countries like Zambia, Mozambique, Sierra Leone are now looking back at the project and see the potential of replicating it. The project has gone far beyond and is called ‘The largest community mapping project in Africa’. Having datasets with details in the fast-growing and unplanned city like Dar es salaam is a big step toward creating a better and resilient city. This is what other countries that are growing as fast as Dar es Salaam look up to, and see how they can design a project of this kind.
Tangible Impacts:
Datasets/maps, tools, learning materials and documentation of the project will be carried on and used by the Resilience Academy.
Companies using ‘our’ data and methods of data collection to run their activities. For example, Green Waste Pro LTD–A trash collection company in Dar es salaam, worked with us to develop datasets for them to be able to track and locate their clients for better service and revenue. The company’s revenue increased significantly as they started using our datasets. This is the result of the training and support they received from the RH team.
Government institutions changing their way of thinking through our influence and training—something that wouldn’t have been possible without the support of the RH team. I.e President’s Office Regional Administration and Local Government offices (PORALG)—working on administrative boundaries using our technical capabilities.
Institutions/NGOs like OMDTZ and the amazing staff with technical capabilities and managerial skills to run projects have come into existence through the influence of RH.
So, Ramani Huria as a project is ending, but the legacy of the project will still manifest over the coming years under the Resilience Academy and through many other partners and individuals who have changed their way of thinking and doing things through the project. We hope other countries will look to the legacy of Ramani Huria as a model for how community mapping can build resilience in their cities
Data for Waste Management: A Comparison between Formal and Informal Settlements in Dar es Salaam, Tanzania.
For the last 4 years, Ramani Huria – a project based in Dar es Salaam, Tanzania, led by Humanitarian OpenStreetMap Team (HOT) and supported by the World Bank – have mapped the drains, rivers, and other infrastructures across Dar es Salaam, to provide information for flood management. By mapping the city’s most flood-prone wards, we learnt that high urbanization and unplanned settlements have led to the mismanagement of waste materials, with negative knock-on effects.
Dar es Salaam produces an estimated 5,600 tonnes of waste per day, of which about 60% remains uncollected. Much of the waste then ends up in stormwater drains, which pollutes the runoff water, rivers and coastal waters and exacerbates annual floodingevents and the spread of diseases. To assess the extent of the problem, the Ramani Huria team conducted a pilot in two settlements in the city – one formal and one informal – to map clients’ locations and create a digital system of client tracking to support waste collection companies with their daily trash collection.
Ramani Huria partnered with two trash collection companies, Green WastePro Ltd. (operating in formal settlements in downtown) and Joshemi Company Ltd. (operating in informal settlements in Tabata Ward). By providing the companies with digital datasets they are now able to locate their clients and significantly improve the sanitary conditions of neighbourhoods as well as reducing the risk of flooding. We have reported earlier on the usability of this data on informal settings and published an article on how these datasets can tackle waste management in Dar es Salaam.
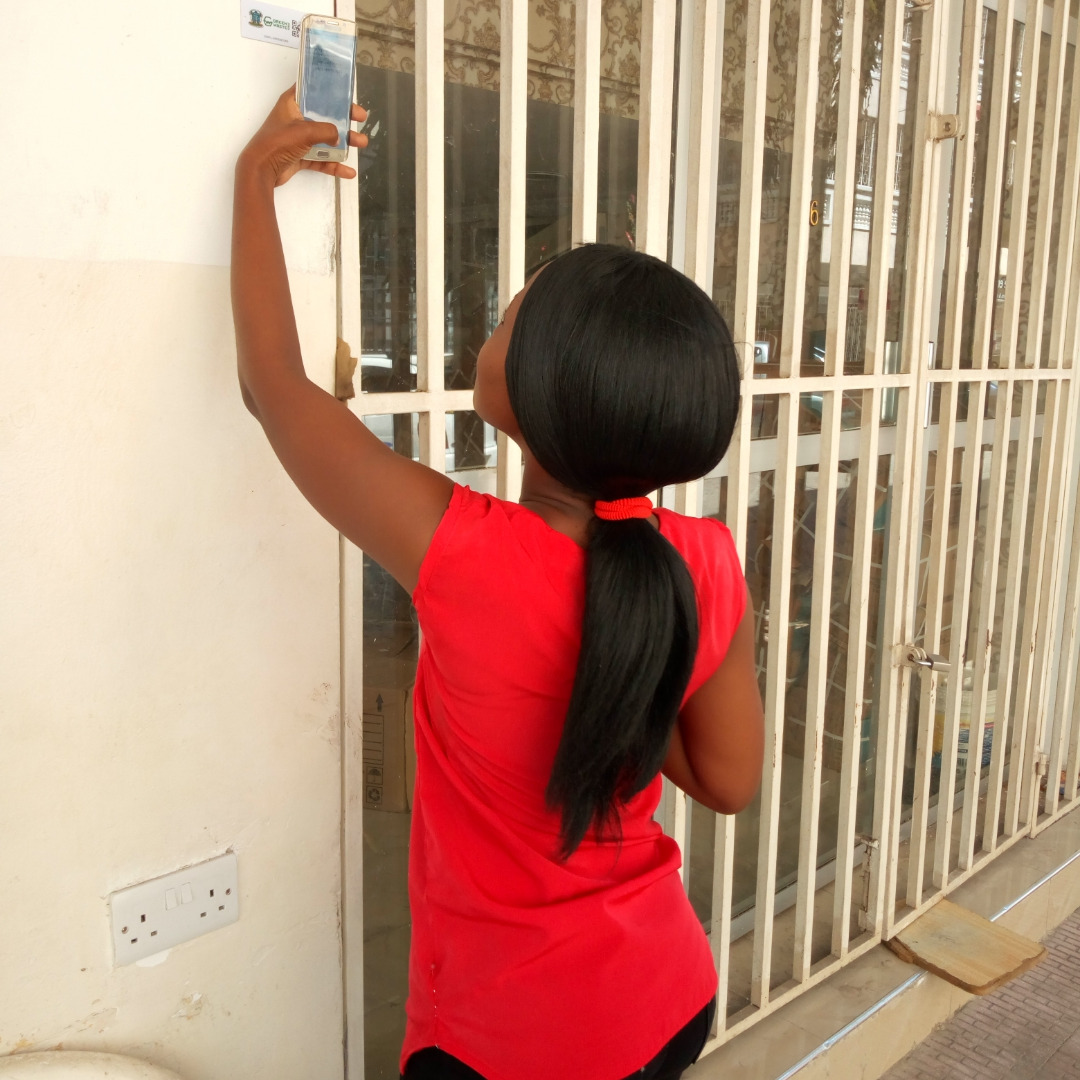
A mapper scanning a barcode when collecting clients location
As 70% of the city is made up of informal settlements, HOT decided to develop data on unplanned areas. Informal settlements in developing countries typically face severe environmental and health consequences due to ineffective household waste management, but by collecting comprehensive data on the location of the clients, the companies will be able to easily track them and improve waste collection services, hence reducing poor waste disposal and make Dar es Salaam more flood resilient.
With the project coming to an end, we thought we would take the opportunity to reflect on what the data for waste management has shown us and teach us about other growing cities in developing countries. Here are the four main things we have learnt:
Level of awareness
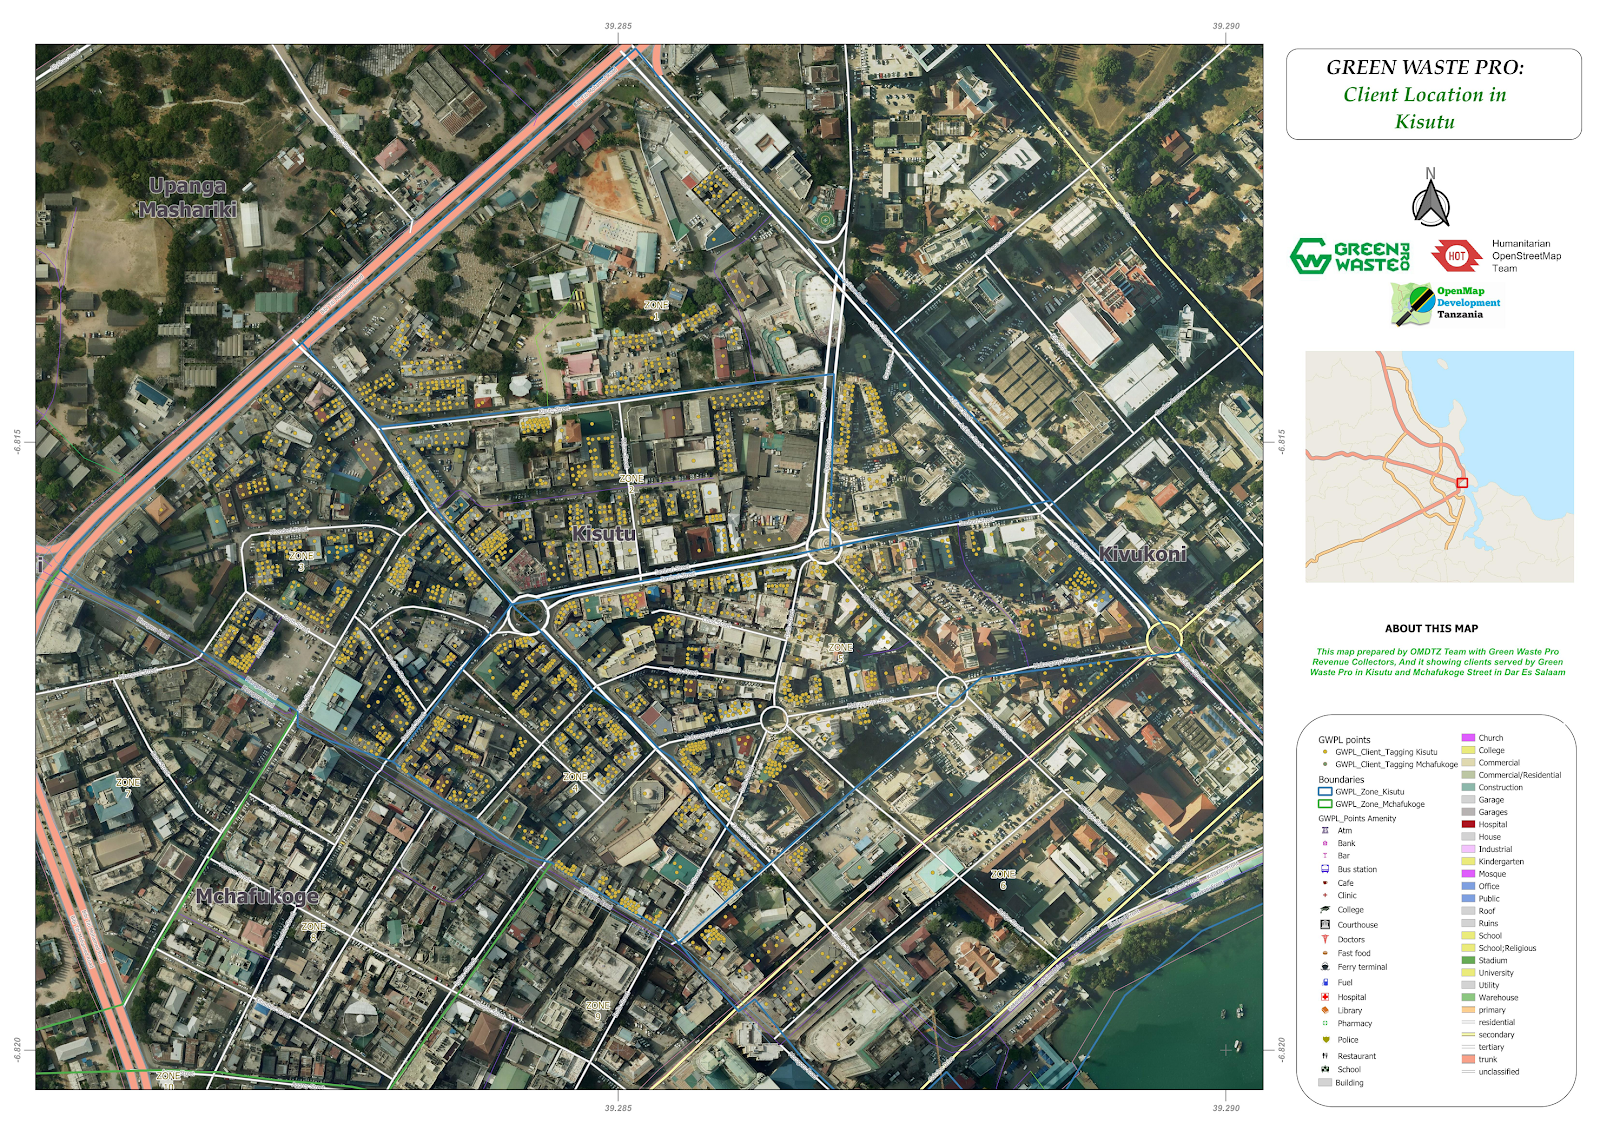
In formal areas, they have a higher level of exposure in the use of technology and technical abilities than informal areas. For example, in formal areas, clients have a unique barcode to identify them, whereas informal settings, our mappers had to assign unofficial ID numbers in order to support revenue collectors by making data collection easier because the ID numbers show the exact location of each client.
A client map developed on pilot wards of formal areas
Companies invest more in planned/formal areas than informal.
Previously, waste management companies mainly operated in formal areas. This may be because of perceived costs as customers in these areas are more likely to pay for the service. There are normally no individual waste collectors on formal areas compared to informal areas where there are many individual (informal) waste collectors, and this may be a reason for companies to invest more.
But as we discovered by collecting data, companies are missing out on revenue opportunities by not collecting in informal areas. In February 2018, HOT provided waste management companies with data that helped improve their collection services in two formal wards (Kisutu and Mchafukoge) which lead to a significant increase in the revenue of the company.
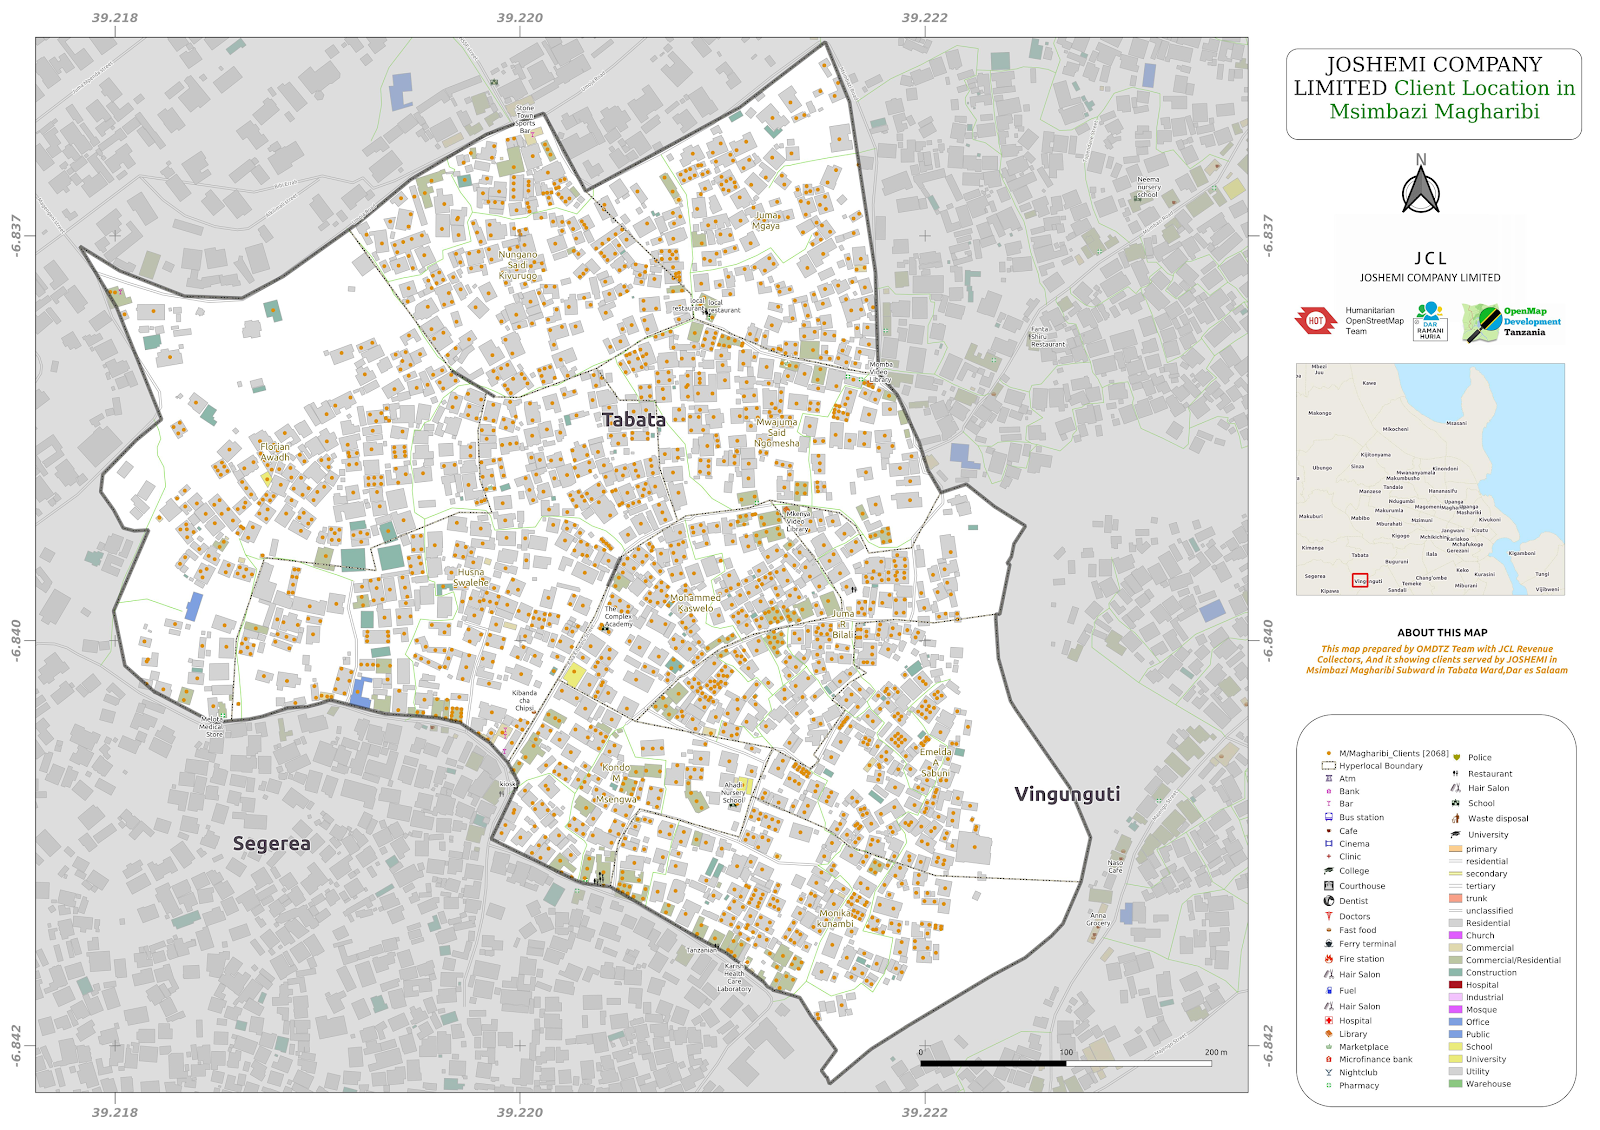
A client map developed for informal areas
Communities in informal settings are left behind when it comes to waste collection.
Communities in informal settings depend on individual waste collectors as most of the companies tend to collect trash from business owners that normally reside along roads. Inaccessibility, as most people don’t live on main roads and the smaller roads/tracks in the informal settlements, are hard to access, lack of information that clearly shows how many people need services and the location of potential customers that need companies’ services may be the reason for the low investment of companies on trash collection. By providing this information, it can help companies and authorities to make better decisions on waste collection, and in turn, making the city clean and reduce the risk of flooding caused by blockage of drainage systems.
There are also weak links to formal systems of waste management chains and neighbourhood responses to bridge these gaps, making them ineffective in localities where the needs for improved services are the most pressing. Data that HOT provided in Tabata Ward helped Joshemi Company Limited (JCL) locate and know the number of potential clients, although it is yet unclear if this has increased revenue.
Waste management systems are rarely described and analyzed from the perspective of communities in informal settings.
A more sophisticated system was developed for formal waste collection companies compared to the system developed in the informal setting. After the mapping a capacity building and daily support on map use from HOT team to support the company’s ability to use data. However, waste management systems are rarely described and analyzed from the perspective of how informality interacts (or not) with formal waste management systems, but the difference is huge yet bringing the same/similar outcome.
As a means of emergency response after a flooding event or inland inundation, flood mapping helps to estimate the extent of the flood on a large scale. It is a basis of coordinating appropriate damage assessment activities, and providing relief to the victims. This blog explains an approach of community flood response by community mapping methods and rapid assessment to determine extent and damage.
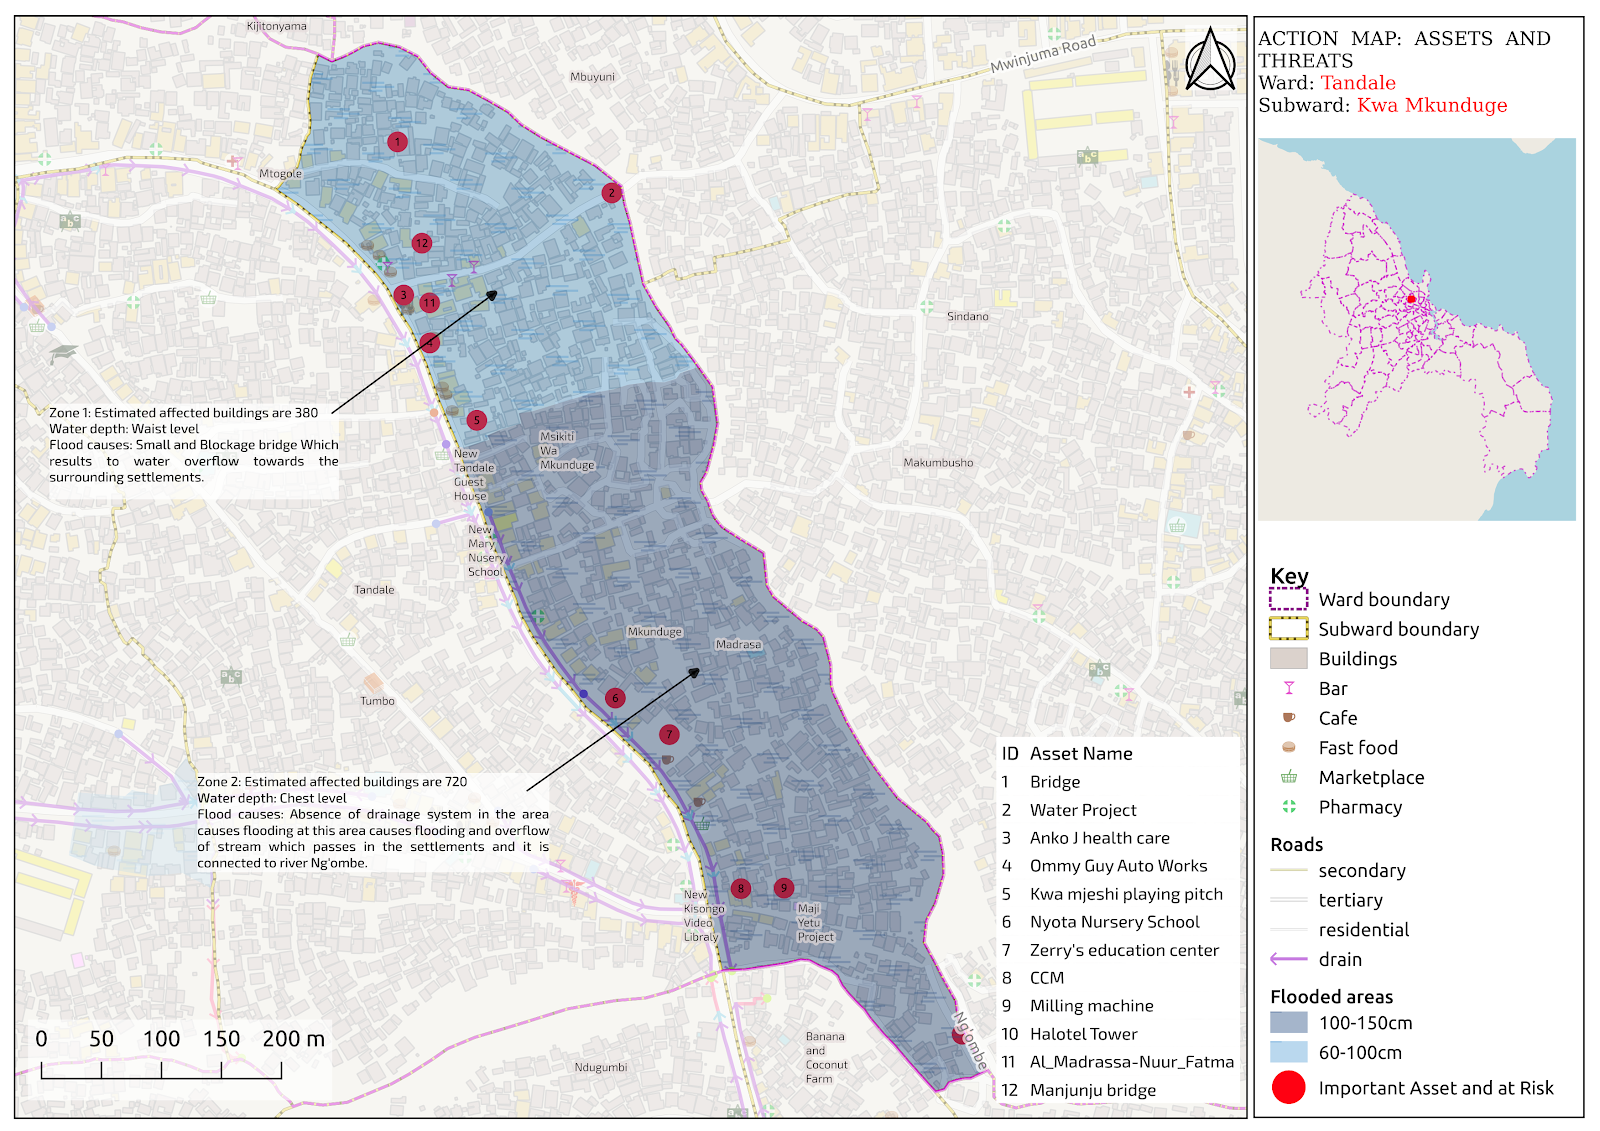
In responding to heavy rainfall on March, 3rd, 2019, that resulted in heavy flooding in some wards of Dar es Salaam Tanzania, the Ramani Huria team decided to conduct field mapping to engage affected communities with the aim of conducting a rapid assessment and producing impact maps. In these wards, community leaders identified a total of 1907 floodedhouses. The survey was conducted in three of the most affected wards as reported by local newspaper (Mwananchi). It appears that the impact was severe on these wards due to multiple river channels meeting at these places causing massive outflows to the residential areas as well as inadequate drainage and blockage due to improper dumping.
Ramani Huria visited the affected wards and worked closely with community leaders to conduct rapid survey and assessment of impacts by:
Conducting meetings with community leaders and identifying the affected areas on printed A1 maps of the specific places
Field visits to physically assess the situation, taking photos and geo-points in some of the affected areas using OpenDataKit Collect, a mobile application that is used for field survey.
The maps used to conduct this assessment are the risk identification maps that were produced by RH team during the 2018 July summer industrial training. As we reported earlier, the maps were produced for the aim of developing ward disaster management plans with the overarching goal of creating a resilient city.
A map showing flooded areas in Tandale Ward, Mkunduge subward was all flooded
The impact of the foods included loss of properties, destruction of houses, students missing schools for two days because the roads were flooded, and their school books/items were destroyed by the heavy flood. Although there were no casualties, the impact affected communities significantly. Other people evacuated to nearby places that were safe at the moment, but in all these wards there were no specified evacuation centers where citizens can run to when it floods. This calls for government, disaster responders, humanitarian organizations, NGO’s and the community in general to “think” and plan how they can make sure there are safe places to stay when it floods.
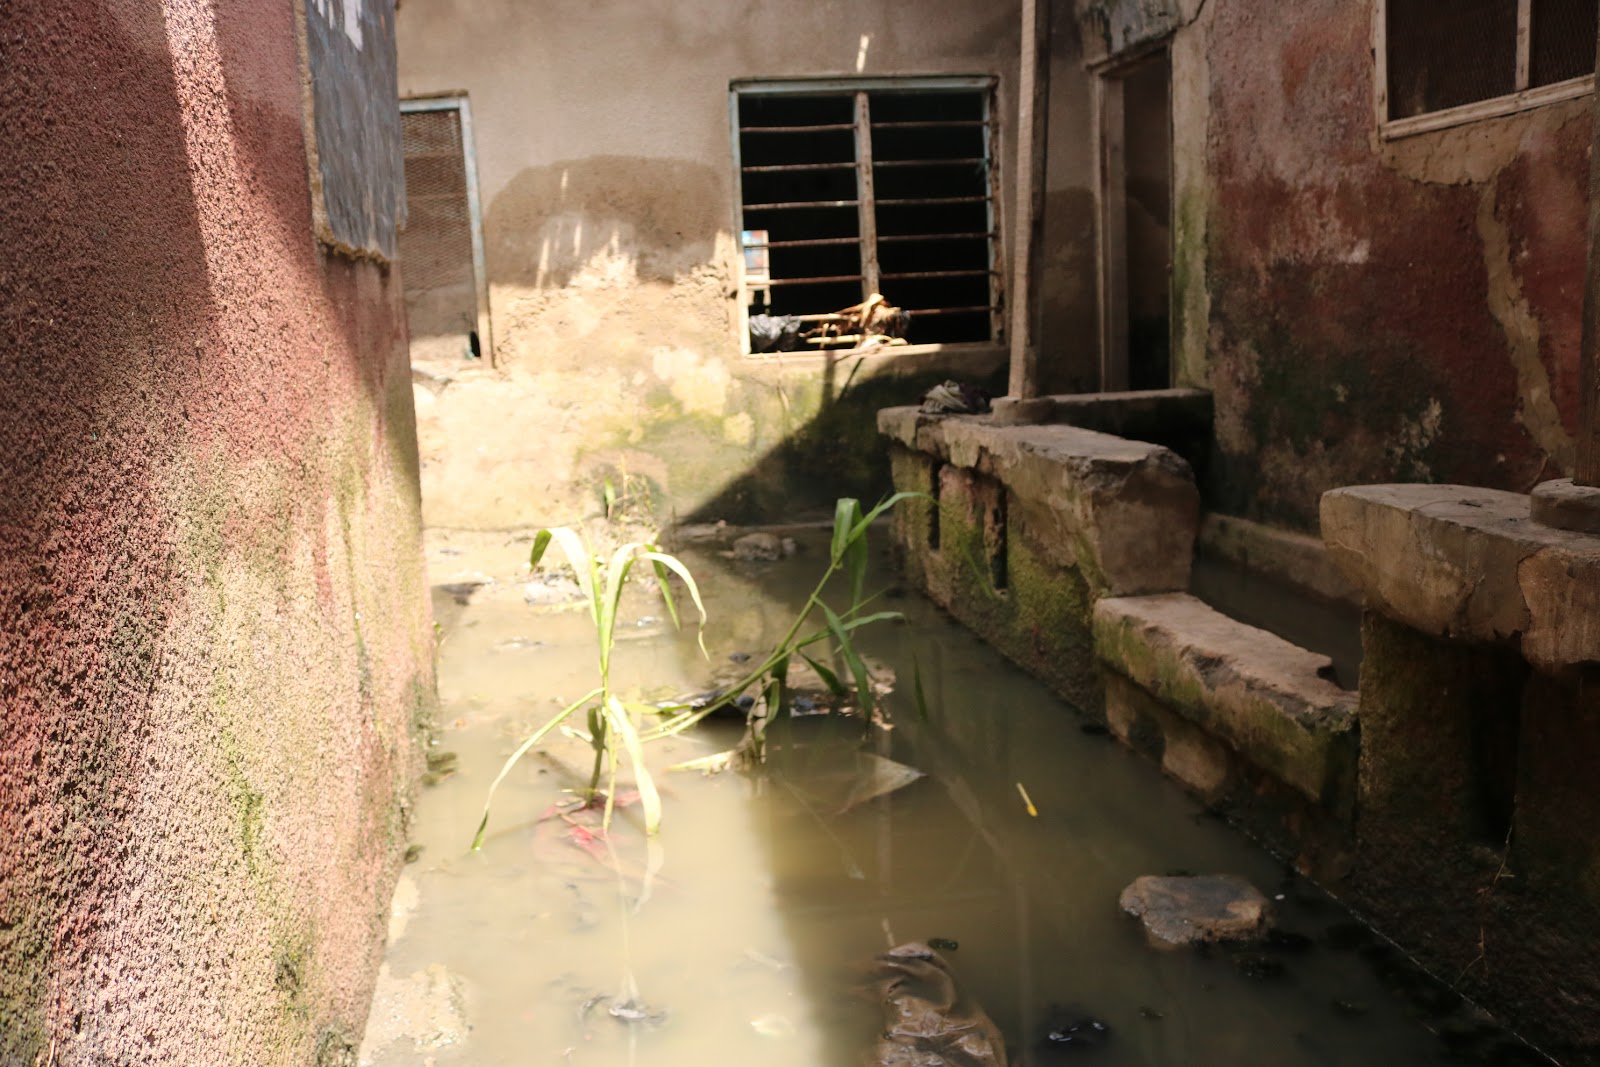
Among flooded houses in Hananasif ward, Dar es salaam. The marks in the walls can explain the severity of flood
The objective of this practice was to identify the extent of flooding in the most affected wards as well as the affected infrastructure such as roads and settlements and impaired areas of interest, for example schools and hospitals. The Ramani Huria team will be actively disseminating this report within the affected communities, and working to facilitate dialogue with PO-RALG, the Red Cross, NGOs, World Bank, and other stakeholders to make use of the information for future mitigation efforts, rescue and relief activities in affected areas.
In recent years experts in disaster responses are hopeful for the future of satellite and mapping technology in responding to disaster. If a flood response map is well developed, what you really have here is a map of the future. It can help in predicting the impact of future flood events and help in mitigation measures too.
Simply by recording data from presently flooded areas can be useful when identifying areas at risk of future flooding. With climate change well underway, people are increasingly interested in predicting the ways that flooding will worsen.
Digital data such flood data needs to be (easily) accessible and downloadable data for disaster responders to act quickly and save lives. Thanks to local people, local devices (mobile phones) and open knowledge (free software like OpenDataKit and the skills to use it), they say information should become even more accessible in the years to come. Flood data also needs to be in online interactive maps that can be integrated with mobile applications for easy access. The Ramani Huria team will be willing to provide such data so as to help more people and develop effective flood mitigation measures.
Dar es Salaam is one of the fastest-growing cities in Africa. The population is expected to grow so much, that Dar es Salaam is projected to be the second-largest city by population in the world by 2100, with a predicted population of 76 million, (according to World Population Review). The annual growth rate is expected to average 4.39% through the year 2020. In the next three years, the population is expected to reach 5 million.
With this rate of rapid urbanization and population increase with 70% of its people living in informal settlements, waste management (the solid waste in particular) is a serious problem. Concurrent with recent socio-economic development, the quantity of solid waste generated has increased at a rapid rate. There have been policies and laws to guide solid waste management in Dar es Salaam but it has never been effective, such that people tend to dump solid waste any way they can as there is no proper and effective way of waste collection
Flooding in Dar es Salaam is mainly caused by blockage of the waterways, i.e. rivers, drains, streams, ditches, etc. People dump solid waste and cause blockages. Materials like metal, plastics, and sometimes natural debris are being dumped causing flooding. Without proper and effective ways of managing waste, floods will continue to overwhelm the drainage system, overflowing into communities, In Tabata most houses are flooded due to blocked drains.
HOT, with their local partner OMDTZ and supported by the World Bank, decided to pilot a mapping activity in an informal settlement (Tabata Ward) similar to what they have done in formal areas (Mchafukoge and Kisutu wards) and create datasets that may help trash company collectors to effectively collect trash from their clients.
HOT and OMDTZ partnered with Joshemi Company Limited, a company dealing with trash collection in Tabata. Tabata is an administrative ward in the Ilala District. According to the 2002 census, the ward had a total population of 46,228. The ward is comprised of eight subwards [Mandela, Kisiwani, Tenge, Msimbazi Mama, Msimbazi Magharibi, Tabata, Matumbi and Mtambani]. It is mainly comprised of informal settlementsand is found along the Msimbazi River valley (the main flooding river in the city).
Joshemi Company has created a weekly schedule for every subward where they have to collect the solid waste. Residents and owners of business firms must pay a certain amount to the company depending on the size of the trash bag.
The Aim of Mapping
JCL needed to know the number of clients as it was very difficult to track them all, revenue flow and an effective feedback system on services provided by the company. The aim was shifting JCL’s analogue system of trash collection to a digital system by providing them with their own maps of clients’ locations and a system of tracking them. This way, JCL would improve their services to clients, increase their revenues and create an effective waste collection mechanism.
Methodology
Pilot mapping was conducted in two subwards of Tabata Ward (Msimbazi Magharibi and Msimbazi Mama). As our policy has always relied on open source software, we used OpenDataKit (ODK) Collect and OpenMapKit (OMK) – an extension of ODK which is a free and open android application for data collection. The team worked with revenue collectors to conduct mapping as they have a better understanding of the area to ease the process of data collection.
Field data collection. Msimbazi subward, Tabata.
The team prepared an excel sheet with ward, subward name, name of mjumbe, location together with client information including name, phone number, month, amount and receipt ID. To ease the process, fake ID numbers were created to identify clients’ houses because in informal settlements there are no house numbers. The sheet was then printed and given to the mappers for data collection, data cleaning and processing.
Fake house ID numbers are given to identify houses (The layers of buildings visualized on OMK application)
The team training JCL on how to use ODK and OMK in the field at Msimbazi Mama, Tabata
Outcomes and Impact
The company has a full understanding of the location and number of clients and challenges that their clients face. As the company now knows the number of clients, they plan to improve their services by having more trucks and more trips. Before mapping, they were only serving 300 clients, and after mapping, they have come to a realisation that there are 2000 clients that need to be provided with the service. This will not only increase the company’s revenue but also improve service to the citizens and keep the ward clean.
Johanes Petro, a mapping supervisor at OMDTZ is very positive about the initiative. He said,
“This initiative will lead to improved waste management as the company now knows they have many clients, they may double or triple services and the clients will be serviced accordingly. In turn, this will increase revenue to the company and improve services to citizens”. He added, “There is a need to replicate this process to all informal settlements in Dar es Salaam which will contribute to a sustainable and clean city as the system created is user-friendly”
Note:
Until now, our team is working with the revenue collectors to capacitate them on data use and help to establish the link between the excel sheet prepared and established layers of OMK.
Challenges in Data Collection
The team started the process of data collection with the revenue collectors, but the revenue collectors were a bit hesitant to provide full collaboration as they were fraudsters and printing counterfeit receipts. So they believed if the company is provided with reliable data and the exact number of clients under service, their stealing methods would be revealed. So they did not collaborate and the company fired them.
Mappers had to shift from working with revenue collectors to shina leaders, famously known as “wajumbe” – the hyper-local leaders (the most granular level of administration that exists in Tanzania). These leaders are responsible to administer a small cluster of houses ranging from 50 to 200 houses, and they are citizens’ primary point of contact. So working with them is an advantage as they are well known and trusted by the community
What is Next?
Seeing the positive outcomes on the two pilot subwards, there is a need to extend the project to the remaining six subwards of Tabata and even to the whole city if we had the support and funding from different partners. Joshemi Company that we’re working with are also eagerly waiting for the extension to the remaining subwards as they understand the power of data now- they even decided to pay community leaders and wajumbe that were helping mappers on data collection.
If this process is replicated in the remaining wards of the city, trash collection will be easier, the city will be clean and may also reduce the intensity of flooding as it is normally caused by blocked drains and rivers. There is also a need to develop an integrated solid management system which is cost-effective and that takes into account economic options for solid waste management like recycling. The community and the general public also need to take responsibility for the process by collaborating with waste collection companies because the benefits are reciprocal. Our mappers are working on solidifying relationships between clients and companies as there was observed drift among them.
Since its kick-off in 2015, the Ramani Huria Project has collected numerous amount of data to help mitigating and planning for flooding in Dar es Salaam. Data collected include historical flood extents data, drainage data, infrastructure – buildings, roads, drains, etc. We also conducted flood risk identification in more than 200 subwards of Dar es Salaam and mapped hyper-local boundaries of the city, famously and informally known as “shina boundaries”.
Having all these data was not sufficient to produce a flood model of the city. There was one missing component in the data which is soil characteristics of the city to help in the geomorphological assessment. The existing soil data was too generalized for the whole country which would be of help when trying to understand the nature of the soil of the city.
Ramani Huria partnered with JBA Consulting (specialized in understanding geomorphological features) all funded by the World Bank and worked on developing a surface soil dataset that will be used for geomorphological assessment and soil characteristics of Dar es Salaam in comparison with future flood risk studies in the region. Soil and/or sediments were sampled from Dar es Salaam and nearby districts that border the city because most of the sediments that flow to the city are from the upper catchment areas which are not likely to be within the city. In order to get a complete dataset of sediments form, these areas needed to be examined too.
Methodology
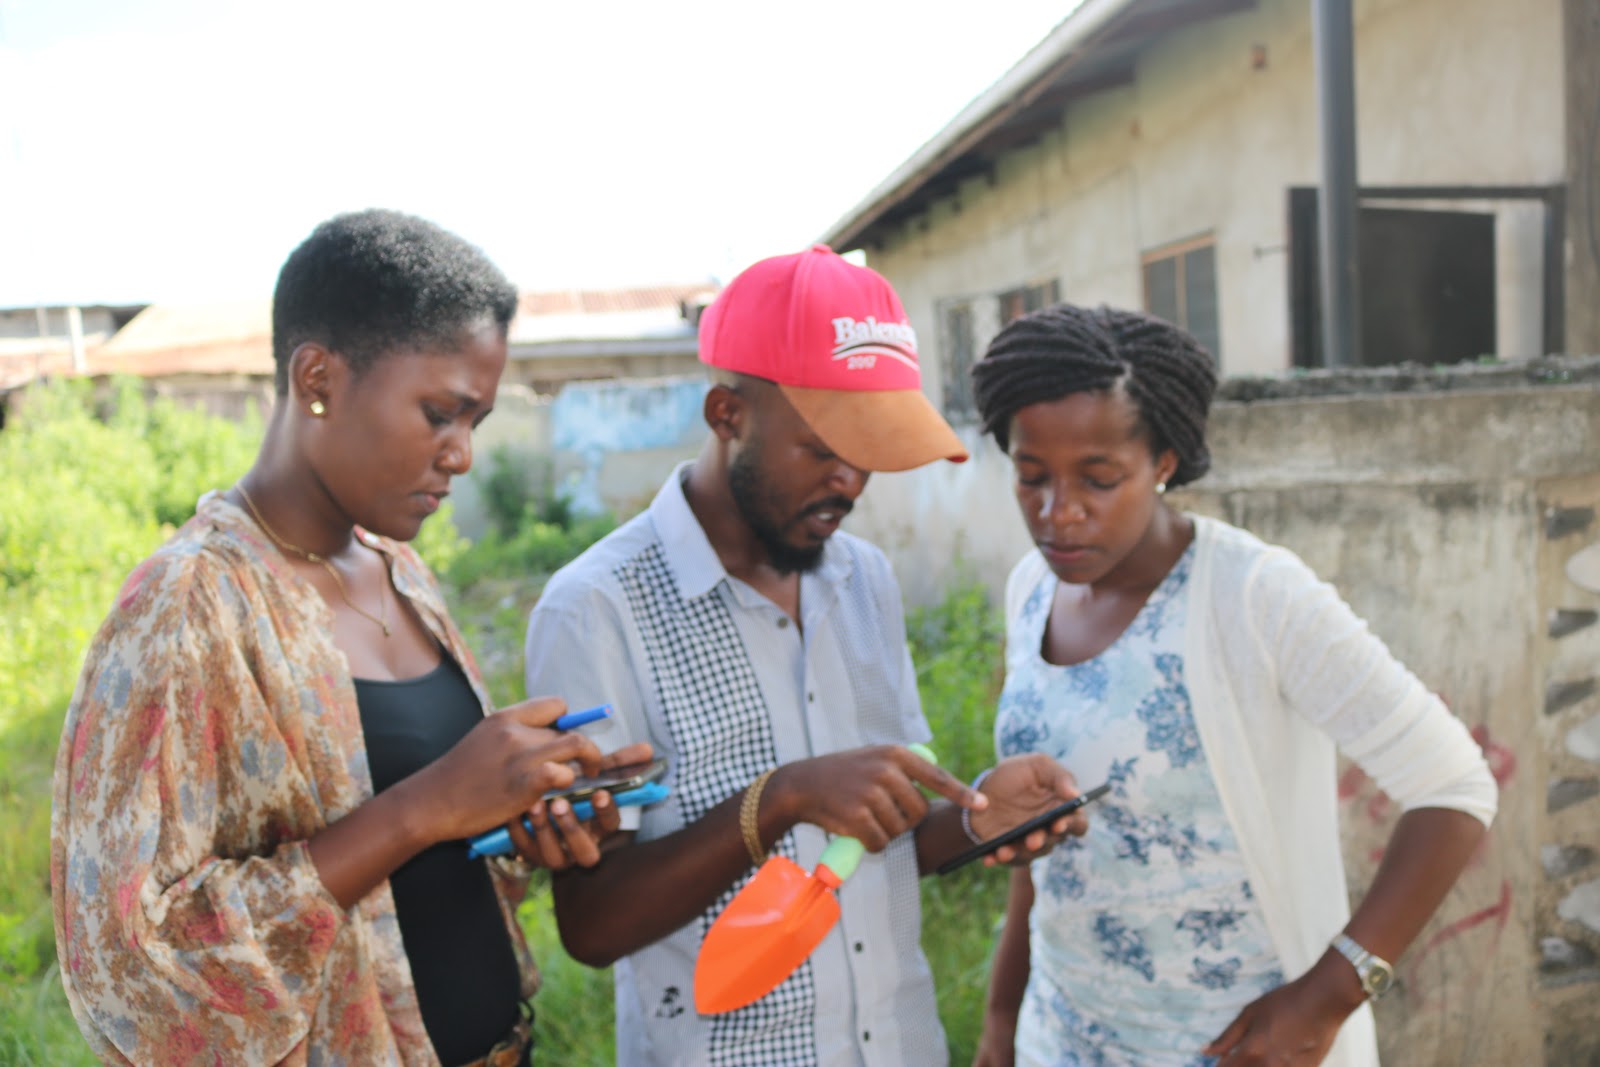
Our partner, JBA Consulting, created 731 sample points on a map using a 2km by 2km regular grid to make sure we get samples for the whole of the Dar es Salaam catchment area. A team of 12 field mappers was then trained in the data collection, with an offset policy in place for points where a sample could not be taken due to inaccessibility. Each sample site had its unique code to identify it, date of sample collection and the name of the mapper to avoid any inconvenience that might occur during the analysis.
In case the sample point was hard to reach or a sample could not be collected for some reasons like paved areas, the mapper had to move about 500 meters north and collect the sample. In order to reach the points for taking the soil samples, mappers were used MapHub on their phone to guide them. When connectivity became an issue the team switched to the Maps.Me application, which allowed them to navigate to points offline simply relying on the GPS on their phones.
731 points represented on Maps.Me Application and Map Hub Application How points are displayed in Maps. Me
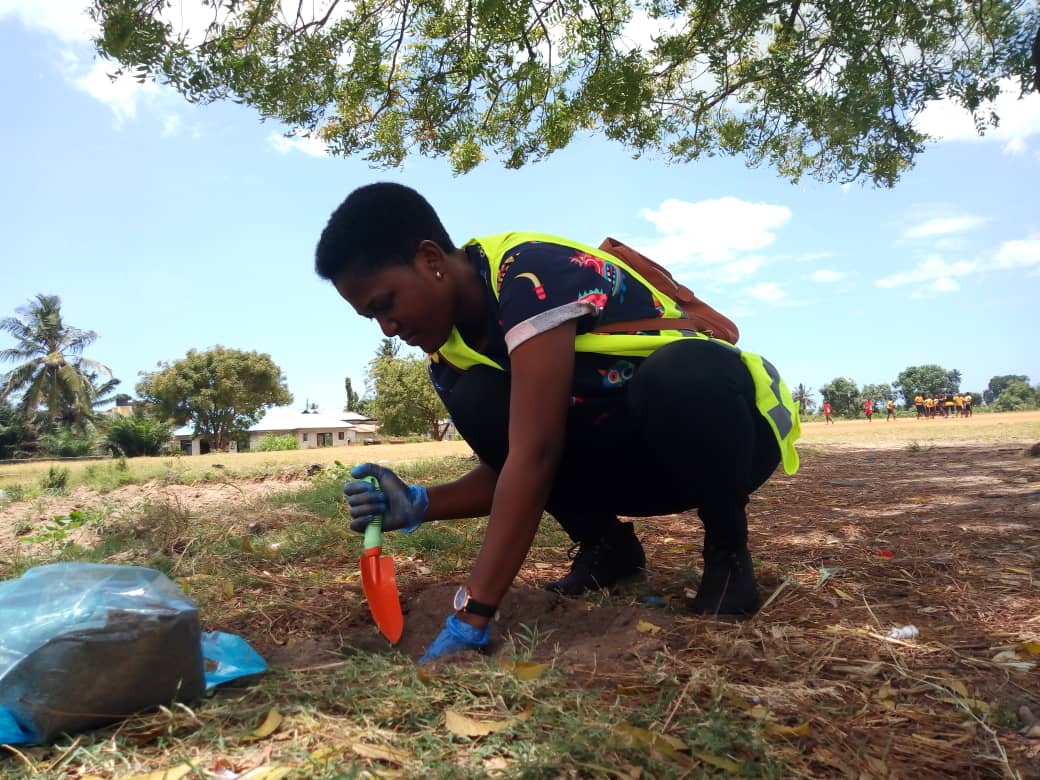
When collecting samples in the field, a mapper needed to take two samples; top sediment at the depth between 3cm -7cm and the bottom sample between 7cm -15cm. When in the field, a mapper would fill out an Open Data Kit survey form about the collected soil sample and take a picture of the surrounding environment.
A mapper in the field collecting a soil sample. Photo, Ramani Huria.
The ODK form had questions to be filled with mappers when they were at the site. The questions included:
The name of the region where the sample was collected, district name, ward name, subward name, the ID number of the sample and also the mapper was supposed to take photos before, during, and after collecting the soil sample.
Filling out an ODK survey form about the sample after collecting it on the field. Photo, Ramani Huria.
Analysis of Sediments
The collected sediments were then sieved to determine grain size distribution. Before sieving, the sample is supposed to weigh 500g, and after sieving, the mass of the soil was recorded on a spreadsheet according to the layers of the sieving tool. There was also a prepared ODK form which was being used to fill in the sieved data to make sure that the data is safe in a server.
Outcomes and Impact
Now that we have soil data of the city and the drainage data is underway to be completed, we will then be able to create an accurate flood model of the city by layering the sediment data and drainage channels data of the city and obtain a more complete understanding of flooding in Dar es Salaam.
Apart from having data on soil characteristics on the city, Our team have learned a lot and increased their level of expertise as they fully participated in sample analysis which is normally done by professionals. The commitment of our team and eagerness to learn new thing is among the best outcome of this activity.
What is next on the RH 2.0 project? As the next phase of Ramani Huria 2.0 is expected to end in July this year, in the coming month we expect to go back to the community and share back the data that we have been collecting over the past months. A number of “shareback” sessions will be conducted and we will build the capacity of local leaders and NGOs on the specific subwards/ wards to make sure they are able to use data collected for different developmental activities.
After the risk identification process implemented in 228 subwards of the city, Ramani Huria is now going further to map the lowest level of administrative system that exists in Tanzania. To do this we have partnered up with Data Zetu to map hyperlocal boundaries in Dar es Salaam for better decision making. Finding people with exact addresses is nearly impossible, as most part of the city is unplanned. Therefore, mapping Dar es Salaam to such a detailed level will allow us to address issues at a neighborhood level for the first time. This is very important and will be used in different levels for decision making from individuals to the government.
Dar es Salaam is divided into 5 municipalities, 92 wards, and approximately 452 subwards (a subward is also known as a “mtaa” in Swahili). Within an mtaa there are further divisions known as “shinas” (which translates roughly to “branches” in English). Shinas are sometimes also referred to as a “Ten Cell”, since originally these areas were home to ten households. Now, due to increases in population, it tends to be between 30 and 200 households per shina. Each shina is administered by a ‘mjumbe’ (plural ‘wajumbe’ in Swahili).
Shinas were originally a political construct, related to the organization of specific political parties. However, wajumbe are increasingly functioning as non-partisan public servants, often the first (and in some cases only) point of interaction between citizens and government. Though the political character of shinas has not entirely vanished, we are finding increasing acceptance amongst citizens and leaders (of all political stripes) of the utility of hyperlocal boundaries being mapped and known to all.
Ramani Huria and Data Zetu have aimed to conduct hyperlocal mapping within 84 subwards of Dar es Salaam. From 13th September to now 128 hyperlocal boundary data have been collected and 106 have been cleaned and verified for final map production.
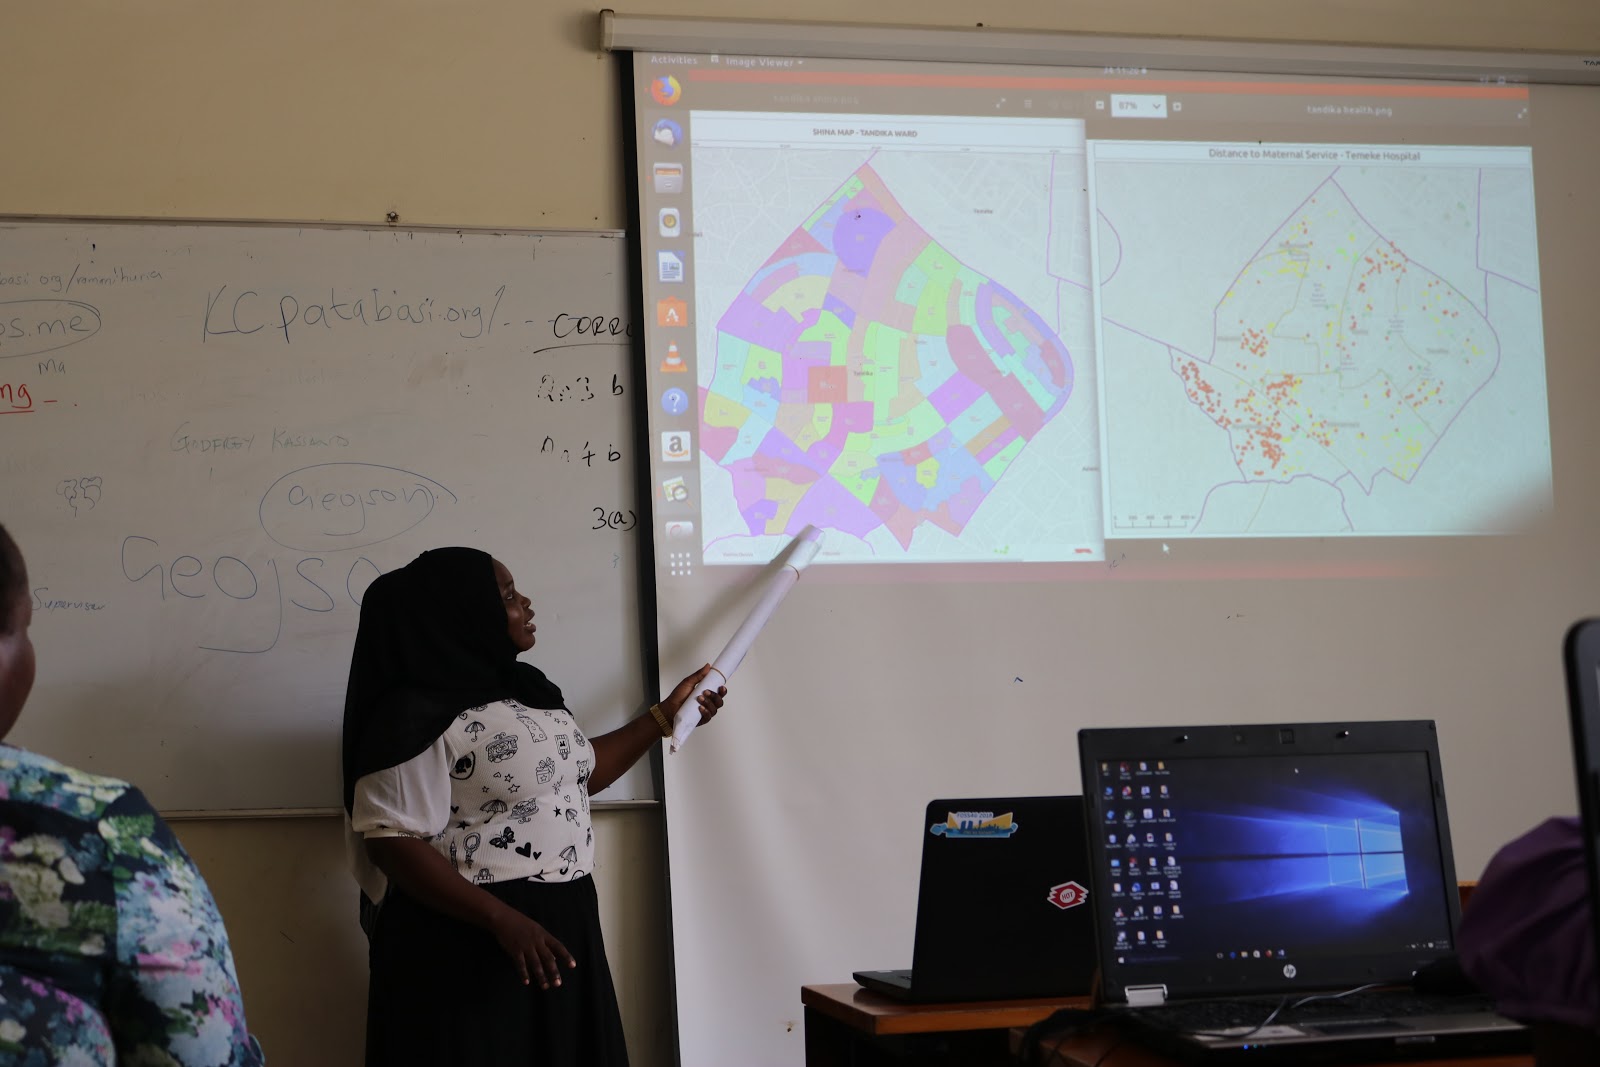
Ramani Huria Mapping Supervisor training university students on how to trace the hyperlocal boundaries and visualized map output. Photo credit: Godfrey Kassano-Ramani Huria
Methodology
A student will need a smartphone/Android phone installed with a revised version of Open Data Kit (ODK) which allows tracing lines/polygons easily.
Mjumbe, who is a shina leader, works with a student (mapper) to trace the boundary of his/her shina – also explaining the possible uses of shinas to enhance collaboration and participation. A student mapper with mjumbe will walk around the boundary creating a polygon-like structure then fill the right information on the survey such as number of shina, name of shina mjumbe and others.
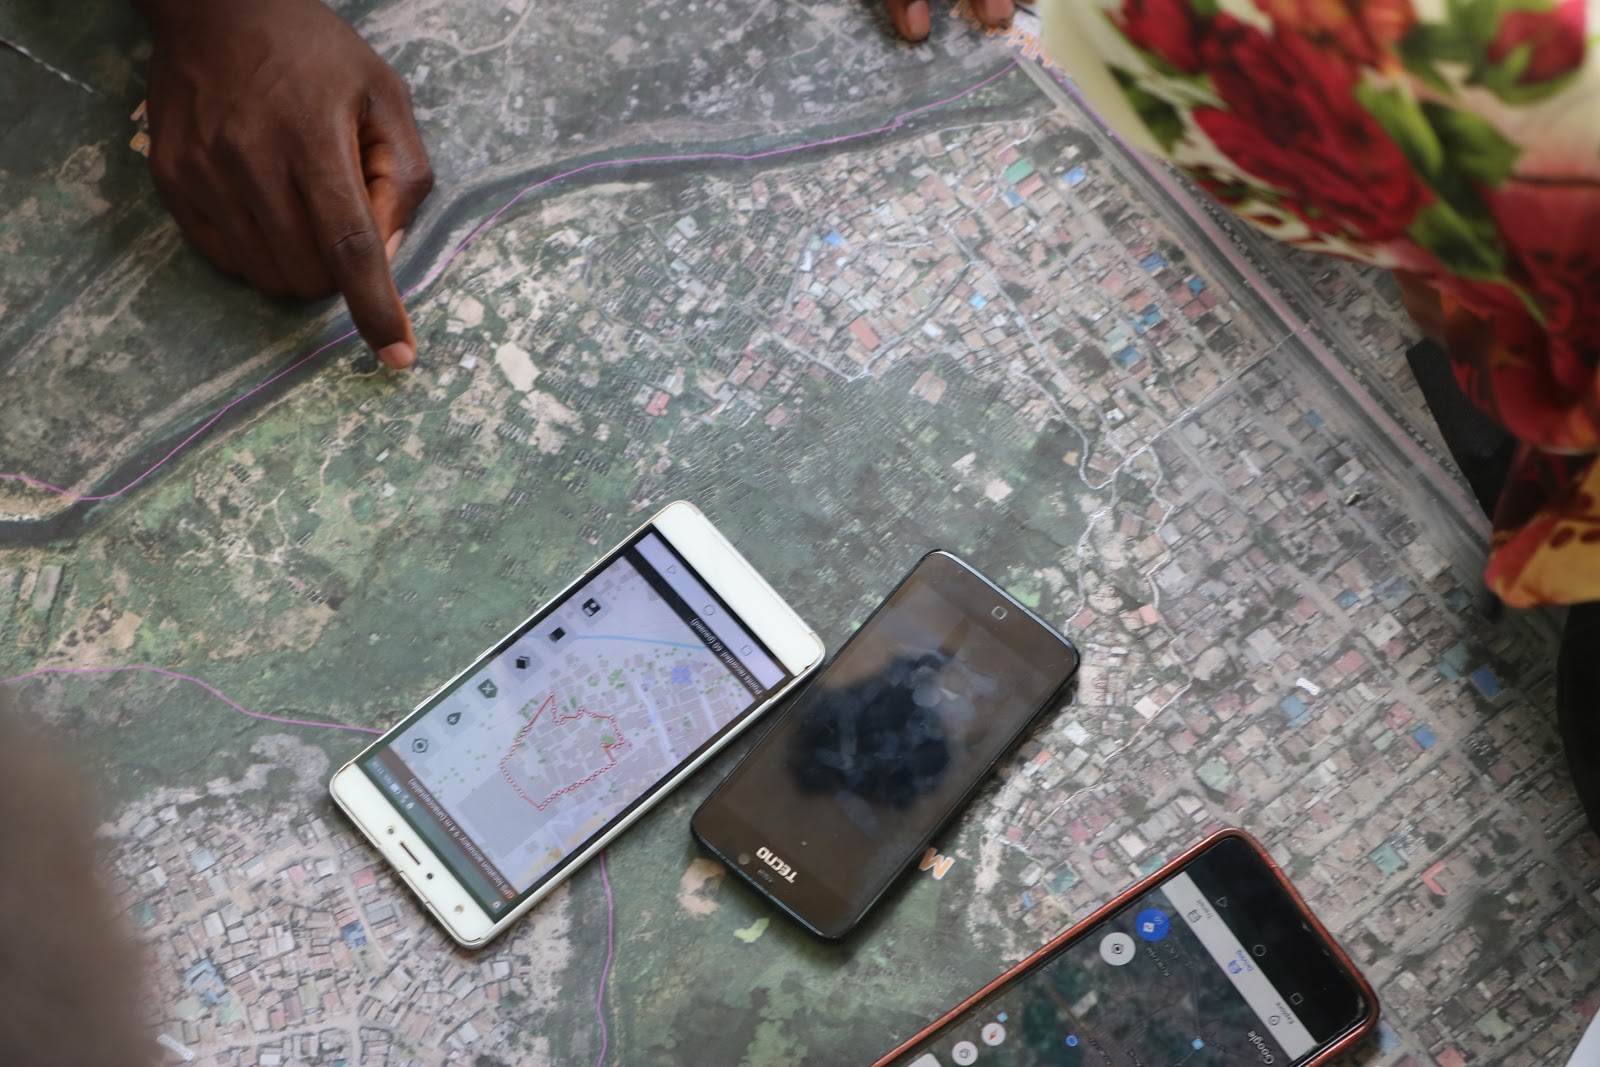
After tracing the shina boundary, mjumbe and mapper use the the printed aerial imagery as a field paper to compare what has been traced from the field with the image to make sure they have traced the correct boundary.
Then students will send a form/survey to the server for further processes.
Data will be downloaded from the server which will be digitized through QGIS software, analysed and a hyperlocal boundary map produced.
Students with shina leaders verifying the correctness of traced boundary on ODK with the printed aerial image of the subward before sending to server. Photo credit: Godfrey Kassano-Ramani Huria
Community Insights
Community leaders had their opinions on the process of mapping shinas and they are expecting these data will be used to benefit them as a community, which is actually the goal of collecting them. Subward chairperson had some thoughts:
“With shina mapping it will help us to solve different problems in our communities since people will be clear with the administrative boundaries of their local leaders. Am happy to work with this organization and hopefully my representatives have fully participated and they are also happy for the work that your doing.” Abdallah M. Simbili, Chairperson Liwiti Subward.
Shina mjumbe in Msimbazi Subward – Tabata Ward showing the student mapper his shina boundary during field data collection. Photo credit: Godfrey Kassano-Ramani Huria
Possible uses of Hyperlocal Maps
Help the ward officers to manage the areas by allowing the ward/subward/shina leaders to better understand the structure of their areas.
In case of emergencies (e.g. fire outbreaks or flooding), shina maps can be of help in responding to these disasters as the location of the target is known.
In hospitals, tracking people’s origin by identifying their shina number at the registry- this will help to track patients with diseases like cholera, or malnutrition in children.
Shinas help the local people to know their representatives on the subward level since most of local problems are solved from the shina level.
Locating Malnourished Children and Help with Intervention
Malnutrition remains one of Tanzania’s greatest human development challenges. Despite displaying seemingly ‘low’ and ‘acceptable’ rates of acute malnutrition, the burden of undernourished children is one of the highest in the East African Region. An estimated 450,000 children in Tanzania are acutely malnourished or weak, with over 100,000 suffering from the most severe form of acute malnutrition.
With one of the highest burdens of undernutrition in East and Southern Africa, it is not solely individual lives in Tanzania that are threatened, but also the economic advancement of the next generation that is at stake. Individuals – both adults and children – who experience varying levels of malnutrition will struggle to take advantage of opportunities in, for example, education and employment that would enable them to improve their livelihoods. Understanding the devastating impacts associated with societal malnourishment, particularly amongst children, it is absolutely crucial that appropriate measures are put in place by those actors who are in a position to do so to mitigate such consequences.
Case Study: Amana Regional Referral Hospital in Dar es Salaam, Tanzania
Through the Data Zetu program, our team has been able to utilize the shina data collected across 36 subwards to support the Amana Hospital – one of 4 referral hospitals in Dar es Salaam serving between 800 and 1200 people each day – in improving their methods for collecting patient location data and enhancing patient origin tracing. One pediatric doctor at Amana Hospital, Dr. Omari Mahiza, has a keen interest in implementing a system that would enable him to record and track the location of the malnourished children he treats. By knowing more precisely where his patients are coming from, he is able to investigate why and the reasons for children’s malnutrition from one community to another and, in turn, uncover in more detail the causes that lead to this condition from one household to another.
For the past few months, the Data Zetu team has been working with the IT company who built the electronic medical record system at Amana Hospital to incorporate shina data and nearby landmarks into the system. The new fields in the e-health registry will enable staff to record more precise location data of patients who visit the hospital and support Dr. Mahiza and his colleagues in being able to pinpoint the home address of their patients more easily. Whether the motive is to investigate specific cases of malnutrition and the habits that lead to this condition or to locate the source of a seasonal outbreak, such as cholera, within a community, shina maps allow for this to happen more efficiently within a given community.
The next step for the Amana Hospital intervention is to provide training and capacity-building to local staff, such as registration attendants and nurses, about the importance and value of recording detailed patient location data in the e-registry. To ensure there is genuine understanding and interest among staff to record patient location data more systematically, our team will focus on facilitating discussions and highlighting use cases that exemplify the role that maps and other spatial tools play in strengthening public health in communities.
Beyond health interventions Shina maps can also be used in disaster management, facilitating disaster response as well as increasing the overall flood resilience of communities. For example, having more granular level administrative boundaries can increase precision in identifying affected areas and speed up the distribution of relief resources during and immediately after a flood event. Likewise having maps of shina boundaries may also prove useful to local administrators when directing and implementing infrastructural improvements.