After the risk identification process implemented in 228 subwards of the city, Ramani Huria is now going further to map the lowest level of administrative system that exists in Tanzania. To do this we have partnered up with Data Zetu to map hyperlocal boundaries in Dar es Salaam for better decision making. Finding people with exact addresses is nearly impossible, as most part of the city is unplanned. Therefore, mapping Dar es Salaam to such a detailed level will allow us to address issues at a neighborhood level for the first time. This is very important and will be used in different levels for decision making from individuals to the government.
Dar es Salaam is divided into 5 municipalities, 92 wards, and approximately 452 subwards (a subward is also known as a “mtaa” in Swahili). Within an mtaa there are further divisions known as “shinas” (which translates roughly to “branches” in English). Shinas are sometimes also referred to as a “Ten Cell”, since originally these areas were home to ten households. Now, due to increases in population, it tends to be between 30 and 200 households per shina. Each shina is administered by a ‘mjumbe’ (plural ‘wajumbe’ in Swahili).
Shinas were originally a political construct, related to the organization of specific political parties. However, wajumbe are increasingly functioning as non-partisan public servants, often the first (and in some cases only) point of interaction between citizens and government. Though the political character of shinas has not entirely vanished, we are finding increasing acceptance amongst citizens and leaders (of all political stripes) of the utility of hyperlocal boundaries being mapped and known to all.
Ramani Huria and Data Zetu have aimed to conduct hyperlocal mapping within 84 subwards of Dar es Salaam. From 13th September to now 128 hyperlocal boundary data have been collected and 106 have been cleaned and verified for final map production.
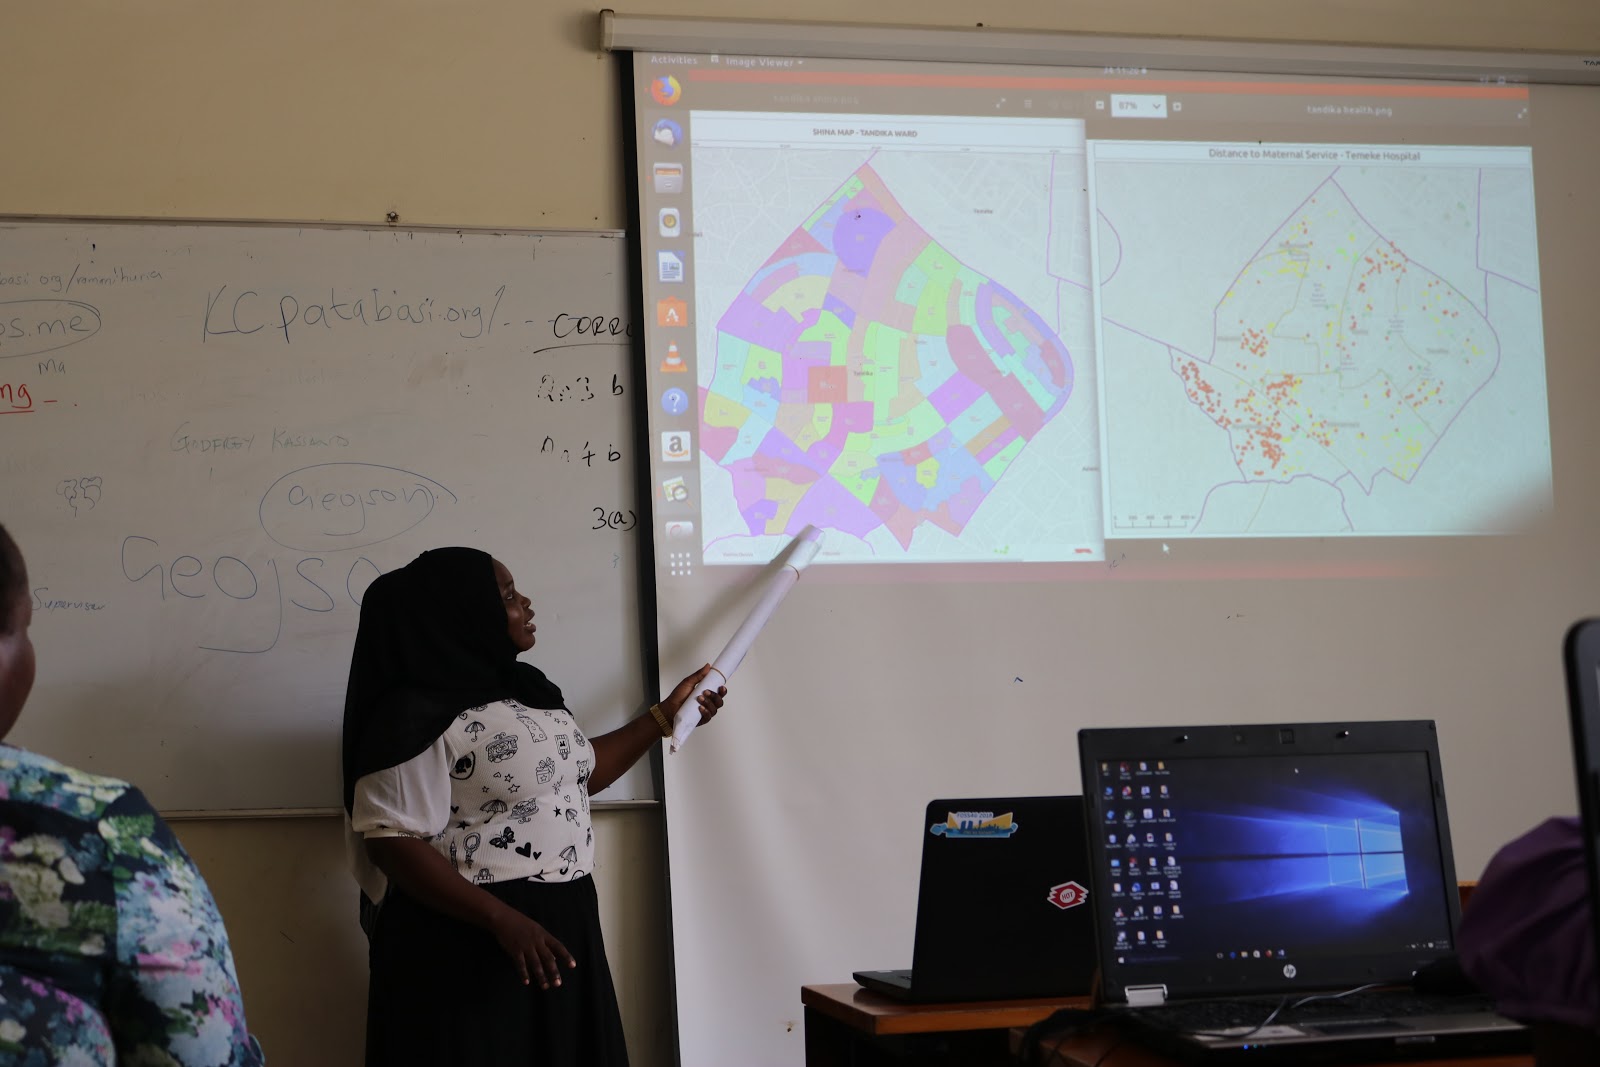
Ramani Huria Mapping Supervisor training university students on how to trace the hyperlocal boundaries and visualized map output. Photo credit: Godfrey Kassano-Ramani Huria
Methodology
- A student will need a smartphone/Android phone installed with a revised version of Open Data Kit (ODK) which allows tracing lines/polygons easily.
- Mjumbe, who is a shina leader, works with a student (mapper) to trace the boundary of his/her shina – also explaining the possible uses of shinas to enhance collaboration and participation. A student mapper with mjumbe will walk around the boundary creating a polygon-like structure then fill the right information on the survey such as number of shina, name of shina mjumbe and others.
- After tracing the shina boundary, mjumbe and mapper use the the printed aerial imagery as a field paper to compare what has been traced from the field with the image to make sure they have traced the correct boundary.
- Then students will send a form/survey to the server for further processes.
- Data will be downloaded from the server which will be digitized through QGIS software, analysed and a hyperlocal boundary map produced.
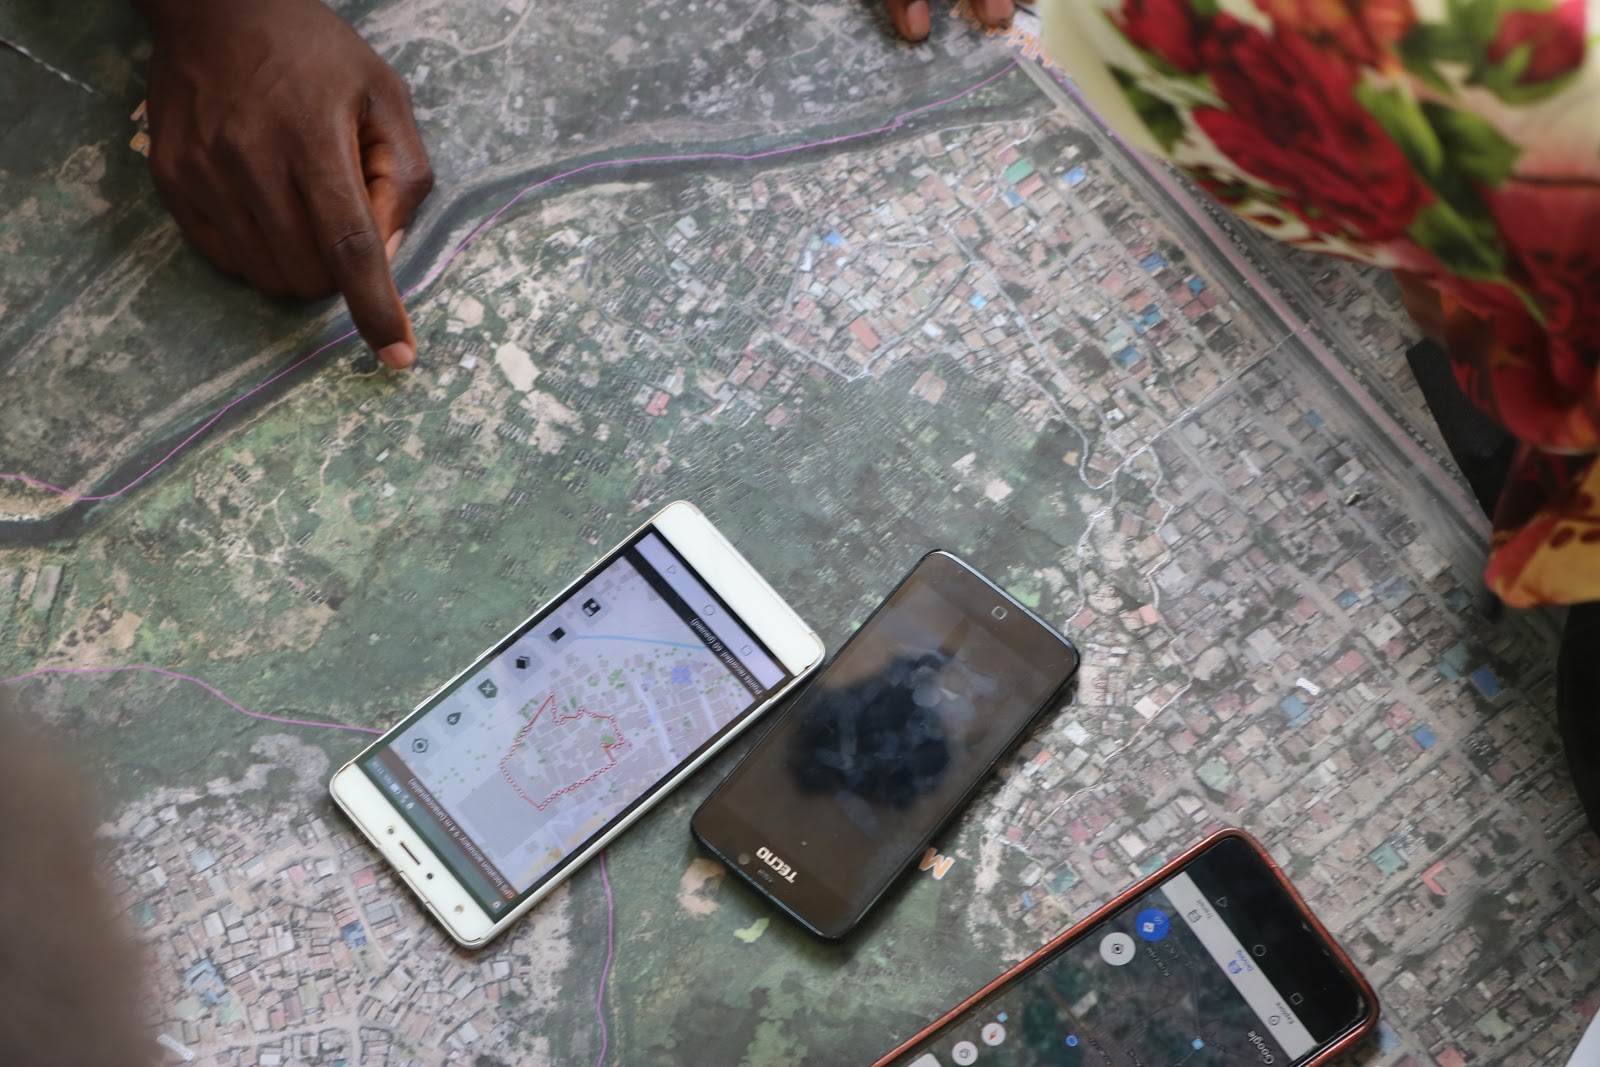
Students with shina leaders verifying the correctness of traced boundary on ODK with the printed aerial image of the subward before sending to server. Photo credit: Godfrey Kassano-Ramani Huria
Community Insights
Community leaders had their opinions on the process of mapping shinas and they are expecting these data will be used to benefit them as a community, which is actually the goal of collecting them. Subward chairperson had some thoughts:
“With shina mapping it will help us to solve different problems in our communities since people will be clear with the administrative boundaries of their local leaders. Am happy to work with this organization and hopefully my representatives have fully participated and they are also happy for the work that your doing.” Abdallah M. Simbili, Chairperson Liwiti Subward.
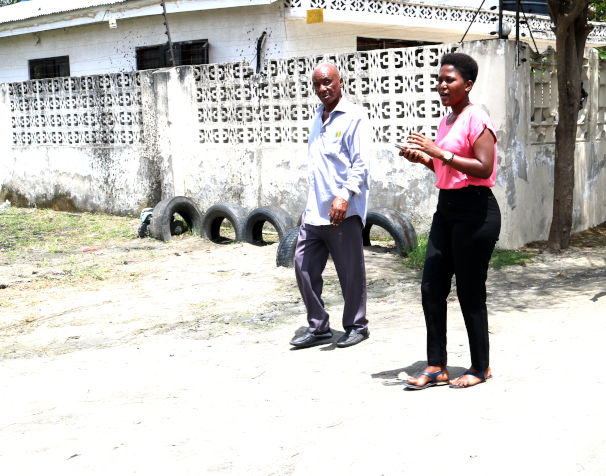
Shina mjumbe in Msimbazi Subward – Tabata Ward showing the student mapper his shina boundary during field data collection. Photo credit: Godfrey Kassano-Ramani Huria
Possible uses of Hyperlocal Maps
- Help the ward officers to manage the areas by allowing the ward/subward/shina leaders to better understand the structure of their areas.
- In case of emergencies (e.g. fire outbreaks or flooding), shina maps can be of help in responding to these disasters as the location of the target is known.
- In hospitals, tracking people’s origin by identifying their shina number at the registry- this will help to track patients with diseases like cholera, or malnutrition in children.
- Shinas help the local people to know their representatives on the subward level since most of local problems are solved from the shina level.
Locating Malnourished Children and Help with Intervention
Malnutrition remains one of Tanzania’s greatest human development challenges. Despite displaying seemingly ‘low’ and ‘acceptable’ rates of acute malnutrition, the burden of undernourished children is one of the highest in the East African Region. An estimated 450,000 children in Tanzania are acutely malnourished or weak, with over 100,000 suffering from the most severe form of acute malnutrition.
With one of the highest burdens of undernutrition in East and Southern Africa, it is not solely individual lives in Tanzania that are threatened, but also the economic advancement of the next generation that is at stake. Individuals – both adults and children – who experience varying levels of malnutrition will struggle to take advantage of opportunities in, for example, education and employment that would enable them to improve their livelihoods. Understanding the devastating impacts associated with societal malnourishment, particularly amongst children, it is absolutely crucial that appropriate measures are put in place by those actors who are in a position to do so to mitigate such consequences.
Case Study: Amana Regional Referral Hospital in Dar es Salaam, Tanzania
Through the Data Zetu program, our team has been able to utilize the shina data collected across 36 subwards to support the Amana Hospital – one of 4 referral hospitals in Dar es Salaam serving between 800 and 1200 people each day – in improving their methods for collecting patient location data and enhancing patient origin tracing. One pediatric doctor at Amana Hospital, Dr. Omari Mahiza, has a keen interest in implementing a system that would enable him to record and track the location of the malnourished children he treats. By knowing more precisely where his patients are coming from, he is able to investigate why and the reasons for children’s malnutrition from one community to another and, in turn, uncover in more detail the causes that lead to this condition from one household to another.
For the past few months, the Data Zetu team has been working with the IT company who built the electronic medical record system at Amana Hospital to incorporate shina data and nearby landmarks into the system. The new fields in the e-health registry will enable staff to record more precise location data of patients who visit the hospital and support Dr. Mahiza and his colleagues in being able to pinpoint the home address of their patients more easily. Whether the motive is to investigate specific cases of malnutrition and the habits that lead to this condition or to locate the source of a seasonal outbreak, such as cholera, within a community, shina maps allow for this to happen more efficiently within a given community.
The next step for the Amana Hospital intervention is to provide training and capacity-building to local staff, such as registration attendants and nurses, about the importance and value of recording detailed patient location data in the e-registry. To ensure there is genuine understanding and interest among staff to record patient location data more systematically, our team will focus on facilitating discussions and highlighting use cases that exemplify the role that maps and other spatial tools play in strengthening public health in communities.
Beyond health interventions Shina maps can also be used in disaster management, facilitating disaster response as well as increasing the overall flood resilience of communities. For example, having more granular level administrative boundaries can increase precision in identifying affected areas and speed up the distribution of relief resources during and immediately after a flood event. Likewise having maps of shina boundaries may also prove useful to local administrators when directing and implementing infrastructural improvements.