The Humanitarian OpenStreetMap Team (HOT) and Ramani Huria, supported by the World Bank and partners are launching a brand-new adventure with Ardhi University today!
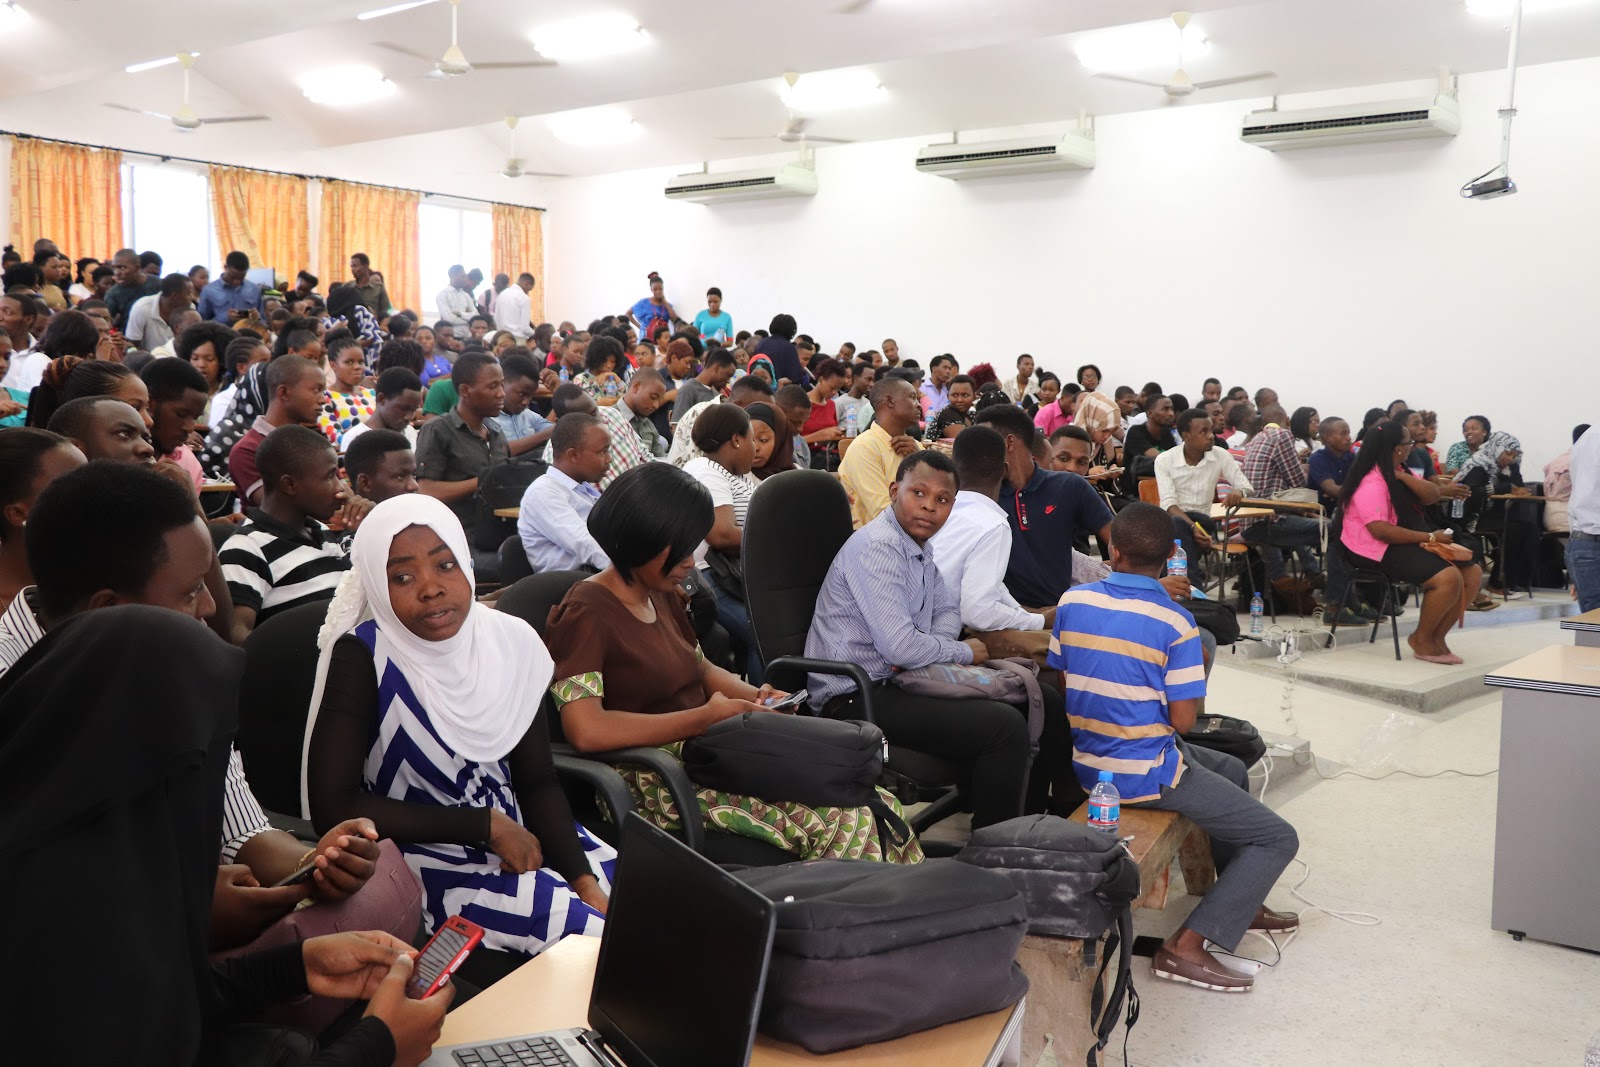
Three hundred Urban Planning and Geomatics students from Ardhi University in Dar es Salaam are participating in a community mapping project in July and August. We will be mapping in 35 wards of the city, with an emphasis on the data needed to improve flood resilience.
With the increasing impact of climate change and urbanization, urban flooding increasingly disrupts and threatens the lives of people in Dar es Salaam. To support people in the city, we are mapping drainage, health care services (important to reduce illness and mortality when flooding does happen, particularly for children), toilets, water sources, and building infrastructure.
We will also be working to better understand where flooding has happened in the past and where it may happen in the future based on the knowledge of people in the neighbourhoods, as well as measurements of elevation, drainage modelling, and so forth.
Training three hundred students in community mapping is a huge challenge and an opportunity! Just to organize such a large cohort is a complex logistical exercise. We must ensure that the students learn valuable skills, produce high-quality data, and work effectively with local neighbourhood communities. Fortunately we have a team including ten of the former students from previous Ramani Huria community mapping projects that have graduated and gone on to be leaders; they will be instrumental in guiding the new students through their learning and mapping process.
Students learning about Ramani Huria, and their role in the project at the UDSM CoICT campus/dLab
As always, the data gathered by Ramani Huria belongs to the people of Dar es Salaam. It is open data, accessible to everyone on the OpenStreetMap platform. Not only is it used for flood management planning, improvements to health care, drainage, and other infrastructure, but people can use this in free, offline maps on their smartphones that do not require Internet data and local businesses can use it to improve customer services. A high-quality map, freely available and filled with locally-useful data, helps almost everyone, and especially so if it belongs to the people themselves!
If you are in Dar es Salaam in the next few months, expect to see our intrepid teams throughout the city gather the essential data that makes the city a better, stronger, more resilient place. And keep an eye on the map!
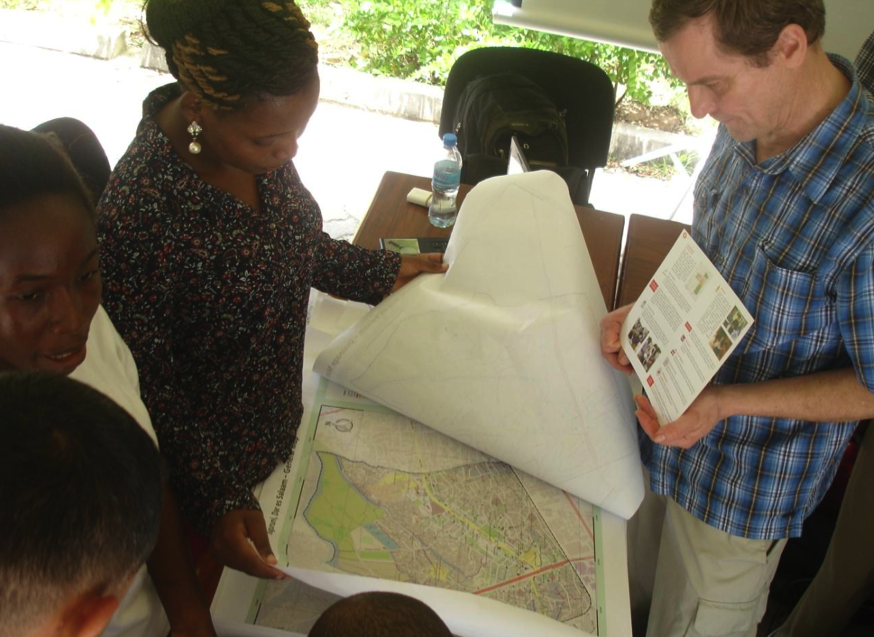
GIS Day was held at the University of Dar es Salaam on Thursday 10th of December, with exhibitions taking place on campus at Nkrumah Hall. The day was an opportunity for Ramani Huria to showcase our ongoing work of community mapping for flood resilience.
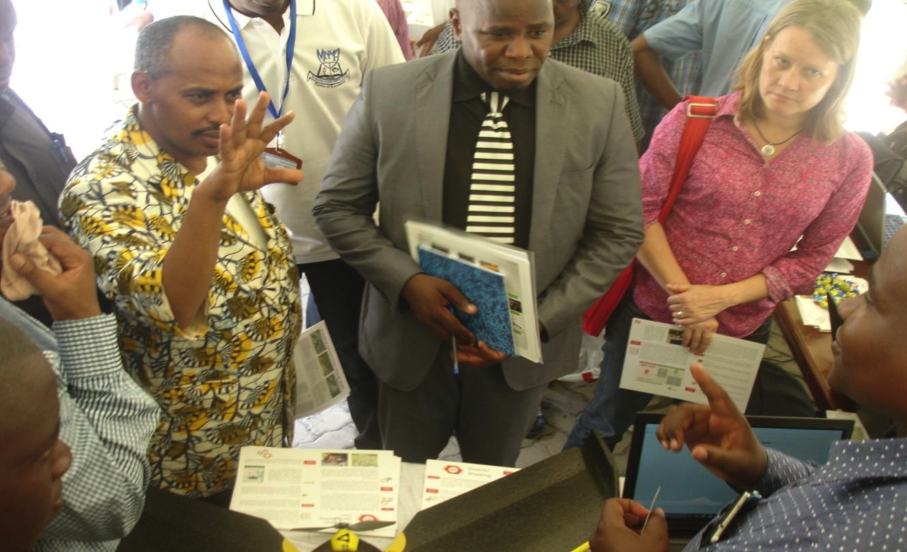
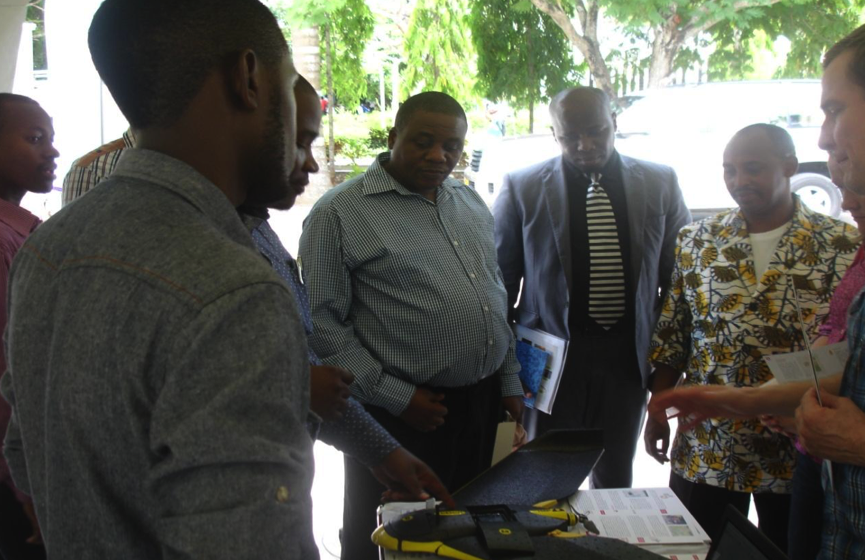
Explaining Ramani Huria’s work to attendees at GIS Day PHOTO CREDIT: Ramani Huria
The day was attended by a range of academics including Dr Mwanukuzi, Head of Geography, University of Dar es salaam; Professor Ylisto, Head of Geography and Geology, Turku University-Finland; Dr Niina, HEI-GIS (Higher Education Institution) Project Coordinator from Finland; and a number of lecturers and students from the Geography Department at UDSM and the wider university community.
Explaining our mapping process and the use of drones PHOTO CREDIT: Ramani Huria
Ramani Huria gave demonstrations on our work, tools used by the project, such as GPS units, software used, such as JOSM and QGIS, and the use of capturing aerial imagery with the use of drones. The use of drones drew attention and attendees were impressed with the high resolution of images collected, included that speed at which imagery can be collected if urgently needed.
Discussing the mapping process with attendees PHOTO CREDIT: Ramani Huria
Many of those in attendance were interested in the open-source element of Ramani Huria’s work. The data we collect is all freely available and we use open-source software whenever possible in our work. This approach allows anyone to freely access our data and further develop it.
While our initial motivation for Ramani Huria is to apply the data collected for flood resilience, there are many situations in which the data could be used according to the needs of the user. City planners and students were very interested in how the data collected could be used for academic purposes such as research and dissertations.
Ramani Huria was grateful to the University of Dar es Salaam for including us in GIS Day and we look forward to participating in many more events on campus in the future.
WaSH is a collective term for water, sanitation and hygiene. While each is a separate field of work, they are interdependent in nature.
After flooding, communities are very vulnerable to outbreaks of disease such as cholera. Building off a foundation of ongoing response efforts for this in Dar es Salaam, Ramani Huria has started a rapid sanitation mapping campaign within the city’s wards, mainly focusing on public toilets.
With the well-trained Ramani Huria team available, this is approached by dividing the team into two groups with two different methods of data collection but the same final output. This offers an opportunity to test which methods can best support the WaSH mapping. The methods used for data collection include:
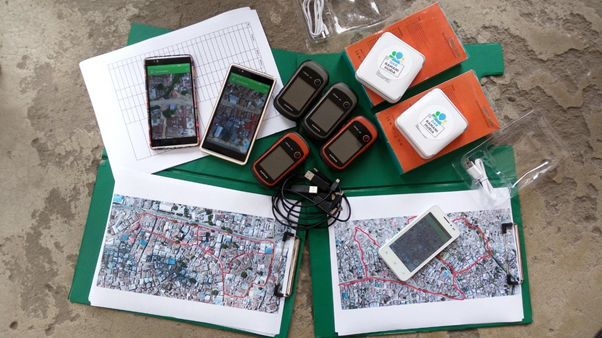
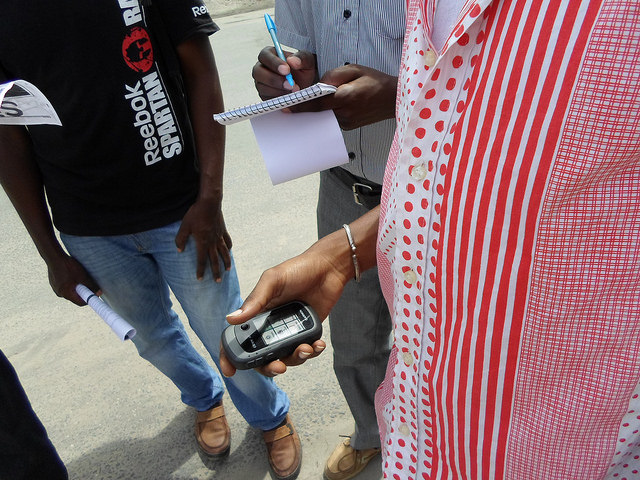
The first method refers to a normal data collection method that involves producing fieldpapers for the site, grabbing a GPS unit and data collection forms, then heading to the site for data collection, while the second method involves installing phone apps that are equipped with data collection forms and imagery for data collection while in the field.
Data collection tools for WaSH mapping, SOURCE: Ramani Huria
Pre-field work
These are activities that are conducted before visiting the site for data collection. The following steps have to be followed before the actual mapping begins:
Preparation of the data model. The data model was developed from the OSM wiki page compiling the toilet tags that are applicable to Dar es Salaam’s situation.
Checking availability of imagery. Imagery, specifically that which has been produced by drones, is helpful in producing field papers for the areas where mapping is to be completed.
For OpenMapKit, data collection surveys using ODK are to be prepared, reflecting the data model that was developed. The surveys include questions that will be filled by mappers while making site visits to collect data.
For the group using GPS units, data collection forms are prepared and printed for mappers to fill while making site visits to collect data.
Producing and printing fieldpapers. The fieldpapers will guide mappers during site visit, showing boundary for the working area.
Last but not least, making official contacts with the ward’s local leaders is a critical activity to take place before mapping. This is done through official lettering.
Fieldwork
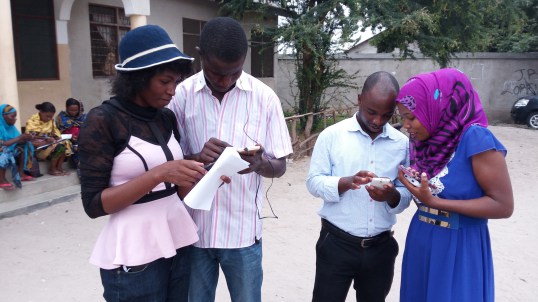
The first task is to check that each and every tool is properly working before heading out into the field. Making sure all smartphones are fully charged and power banks are brought out. After this, the fieldpapers are divided amongst mappers using both OMK and GPS units.
Setting mapping tools before WaSH mapping, SOURCE: Ramani Huria
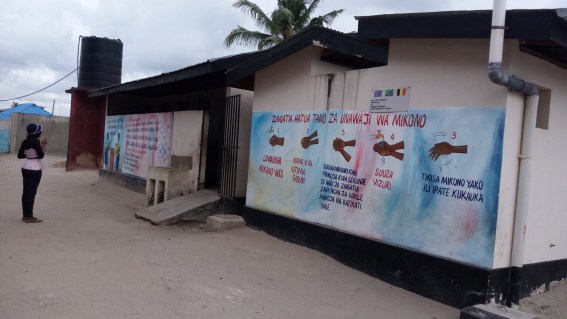
Splitting off for data collection. Every mapper must go to the area from which he/she is supposed to collect data. For both groups, the information collected during the process includes toilet disposal, either by flush/pit latrine/bucket or chemical, accessibility of the toilet, number of chambers per each toilet, who is responsible for the operating toilet, etc. After data collection, mappers return to the working space – most often a ward office.
Mapping in progress, SOURCE: Ramani Huria
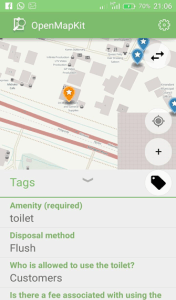
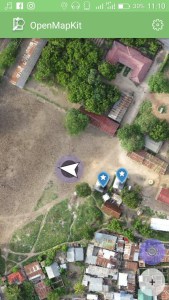
OMK interface showing data needed for collection, location of a mapper, and mapped toilets.
OMK interface showing data needed for collection, location of a mapper, and mapped toilets.
Post-field work
The final step is to enter the data into the OSM platform where digitization using JOSM editor takes place. Both mappers using GPS units and OMK for data collection partake in this activity.
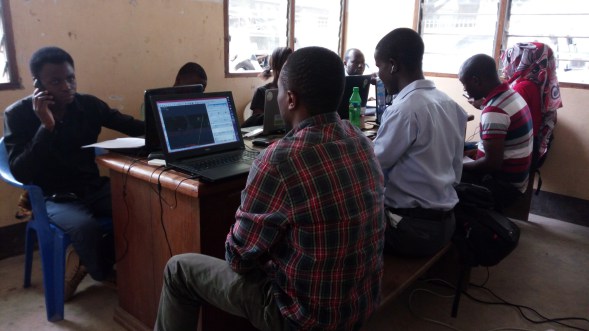
Data entry in the process, SOURCE: Ramani Huria
Comparison, working with OMK and GPS units
OMK is the best method for this task simply because it is the faster method of collecting data – offering mappers the ability to fill out ODK forms on a smartphone and showing mappers their location and imagery at the same time. The much more time-consuming method of using GPS/pen and paper requires that a mapper uses GPS to geolocate the area, a pre-produced fieldpaper to know the site, and a pen and paper for taking notes.
Additional pros
Loading Imagery – OMK can load imagery, eg. drone’s mbtiles, and can be used during site visit while GPS cannot – necessitating the pre-production of fieldpapers to aid mappers during site visit.
Accuracy – GPS accuracy may sometimes decrease due to cloud cover, leading to shifting the point of interest. This is not faced while working with OMK.
Time-saving – OMK saves time when working with JOSM editor, as tags for the toilets are added while filling in the ODK forms during the site visit. As a result, it only requires importing the data onto the computer and JOSM and then uploading it, unlike when the GPS/pen and paper method that requires mappers to manually digitize, add tags, then upload data. The latter is often a tedious process if a significant amount of data was collected.
Fun – It’s more fun working with OMK than GPS/paper method because it’s a smartphone app.
Cons:
Hasara
OMK consumes internet data when using online OpenStreetMap instead of imagery as a basemap background, unlike GPS units that do not have a need for internet as they use satellites to geolocate.
OMK inatumia kifurushi cha mtandao wakati wa kutumia OpenStreetMap kwa mtandao, badala ya picha kama picha ya nyuma, tofauti na vifaa vya GPS haiitaji kifurushi cha mtandao, ambapo inatumia sattelite kuonyesha maeneo.
OMK consumes a phone’s battery while working, unlike GPS units. However, this problem has been addressed by using power banks to charge phones while working.
OMK inatumia betri ya simu wakati wa kufanya kazi, tofauti na kifaa cha GPS, Hatahivyo tatizo hili limeshughulikiwa kwa kutumia kifaa cha kutunzia umeme kuichaji simu wakati ikitumika.
Each year, 5th June marks World Environment Day, a day for raising global awareness to take positive environmental action to protect nature and the planet Earth. This year’s Sunday 5th June saw UWABA (Umma wa Wapanda Baiskeli; or “Public Cycling Community”), a cycling community in Dar es Salaam in cooperation with European Union, organizing the cycling caravan. This is to support low carbon transport, to promote environmental alternatives to high carbon transport as well as putting emphasis on the presence (or absence) of bicycle roads/routes in the city.
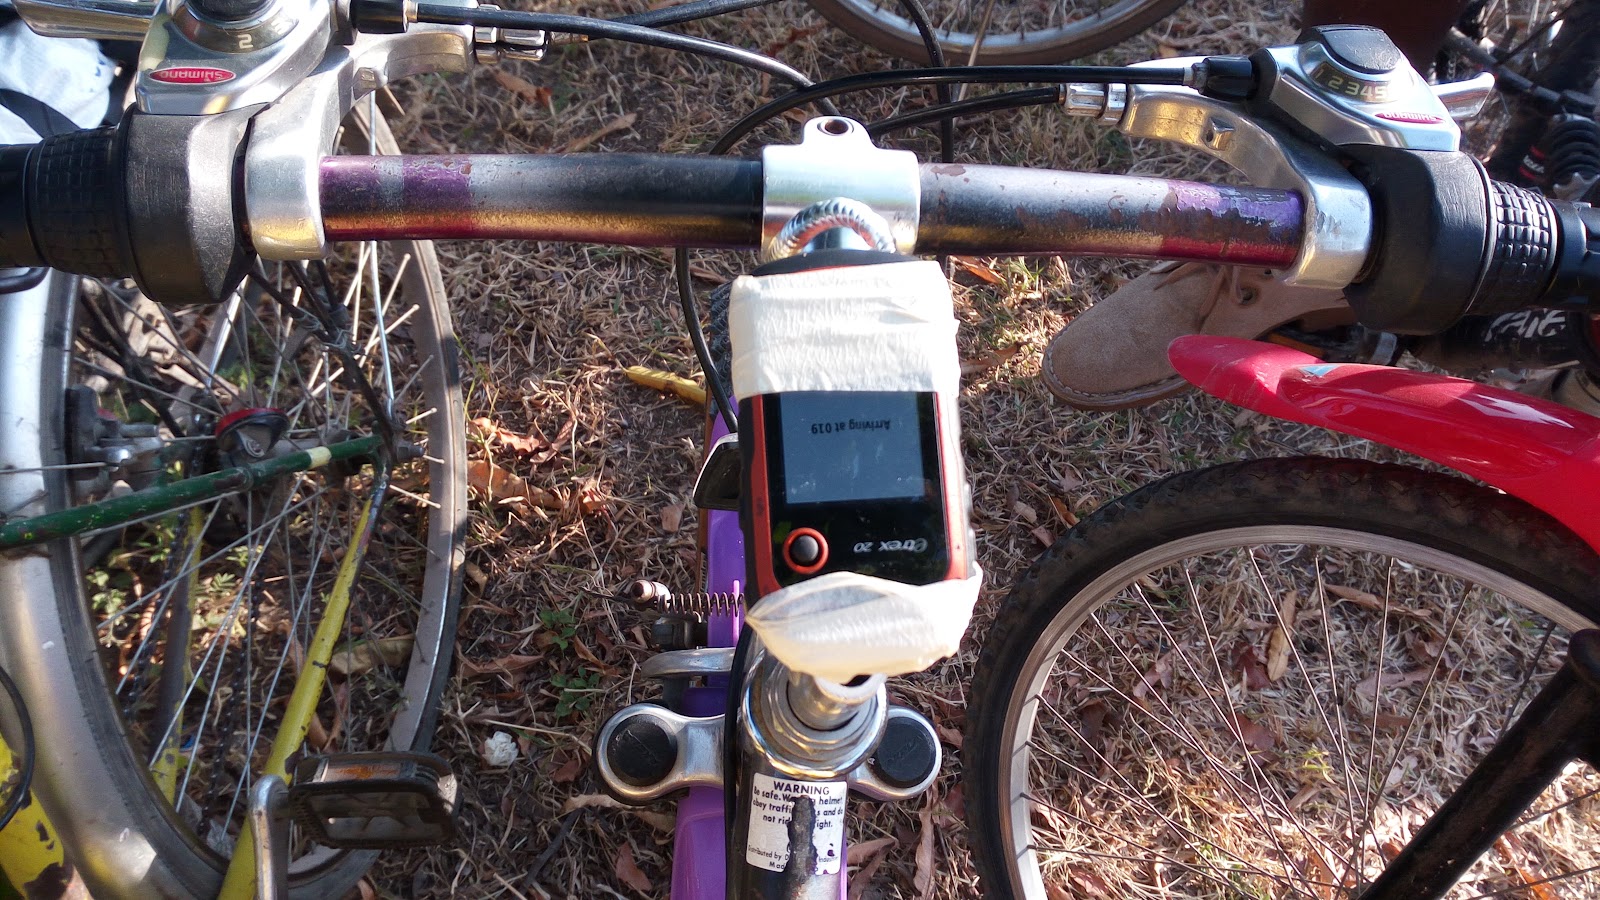
With the motivation to do the mapping for the city, Ramani Huria fully participated to support the initiatives by UWABA community and map the possible bicycle routes around the city. This was done by tracking the caravan’s route with the use of GPS units tied on the bicycle.
GPS attached to a bicycle
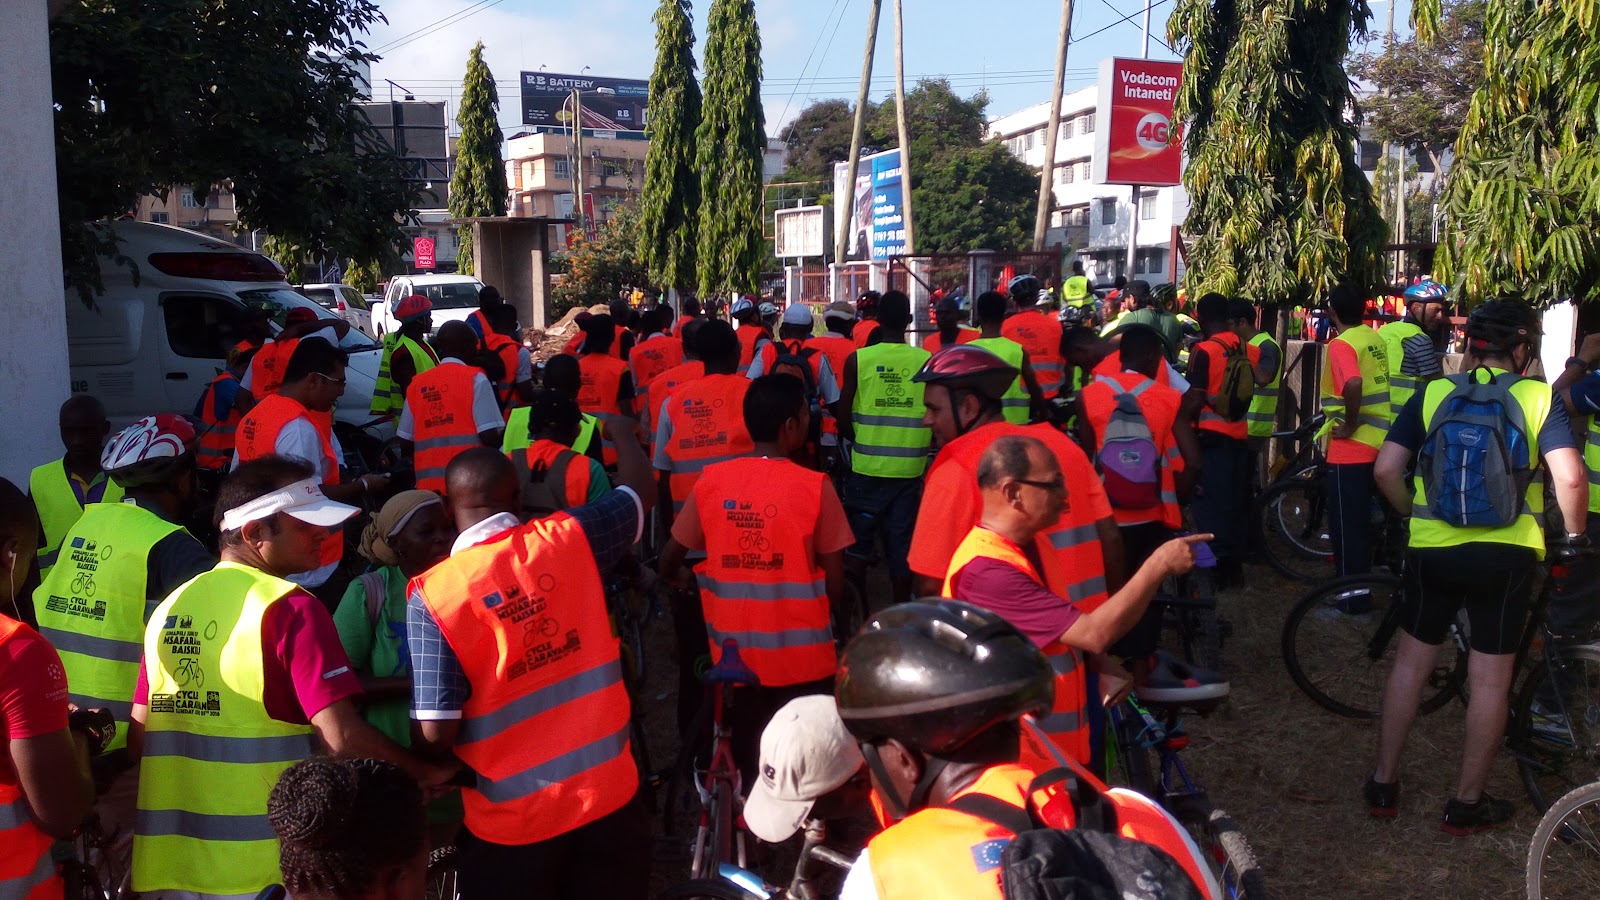
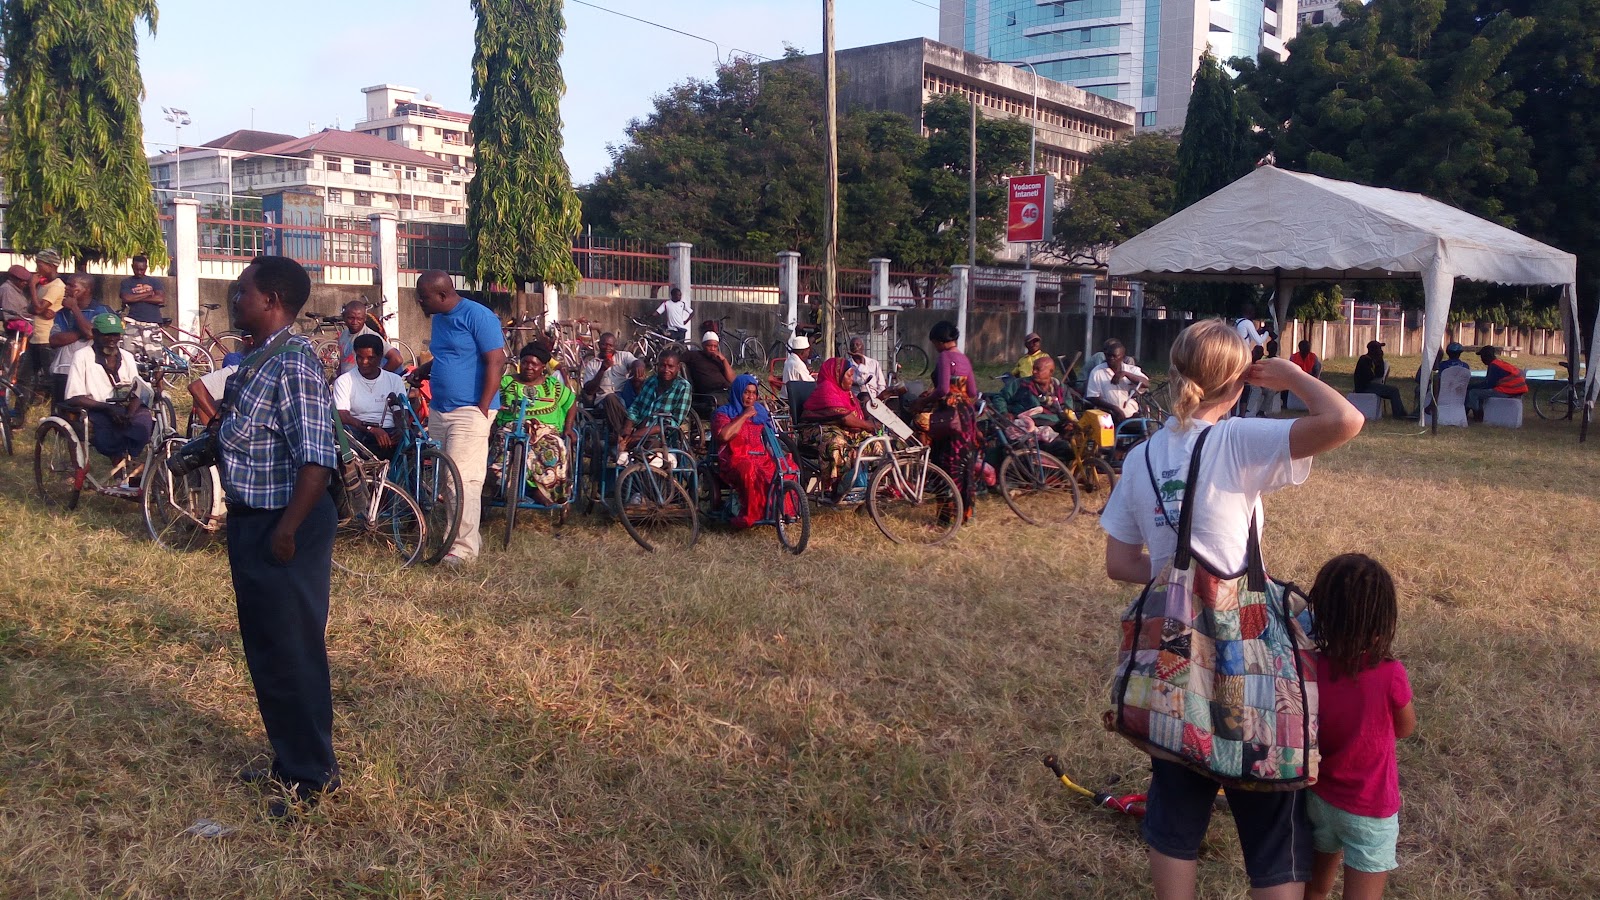
The event was scheduled to start at 7 AM at the Mnazi Mmoja grounds with the registration of the participants, provision of free reflector jackets, bicycle helmets and bicycle reflectors to all participants.
Participants with their reflector jackets on.
Most of the attendees for the event ranged from disabled people with hand bikes and abled people including women, children and men with the coverage of different media sources.
Disabled participants in the back
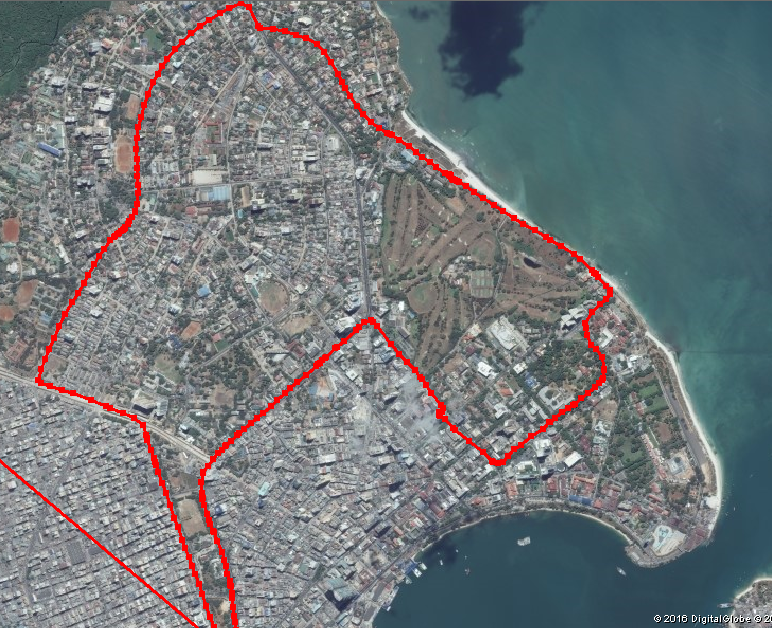
After all, attendee arrives, including January Yusuph Makamba, a minister of State in the Vice President’s Office for Union Affairs and Environment, the caravan started at 08:45 AM. The route went along Bibi Titi road, Ohio Street, Sokoine Driveway, Chimara Street, Barack Obama Drive to Agha Khan Hospital, where people had a short break to catch their breath. After that, the caravan continued to Selander Bridge and took the United Nations Road to Morogoro Road (Fire Squad Headquarters), followed the Morogoro Road and caught Lumumba road back to Mnazi Mmoja.
Throughout the process, the routes used for the caravan were basically not only meant for cycling purposes but rather, they were roads for general uses such as cars, motorcycles etc. With the escort and support from traffic police, cars within the major roads were blocked leaving a clear way for the caravan to go through. This isn’t an everyday occurrence, with cyclists usually competing for space with traffic.
The caravan’s route around the city centre.
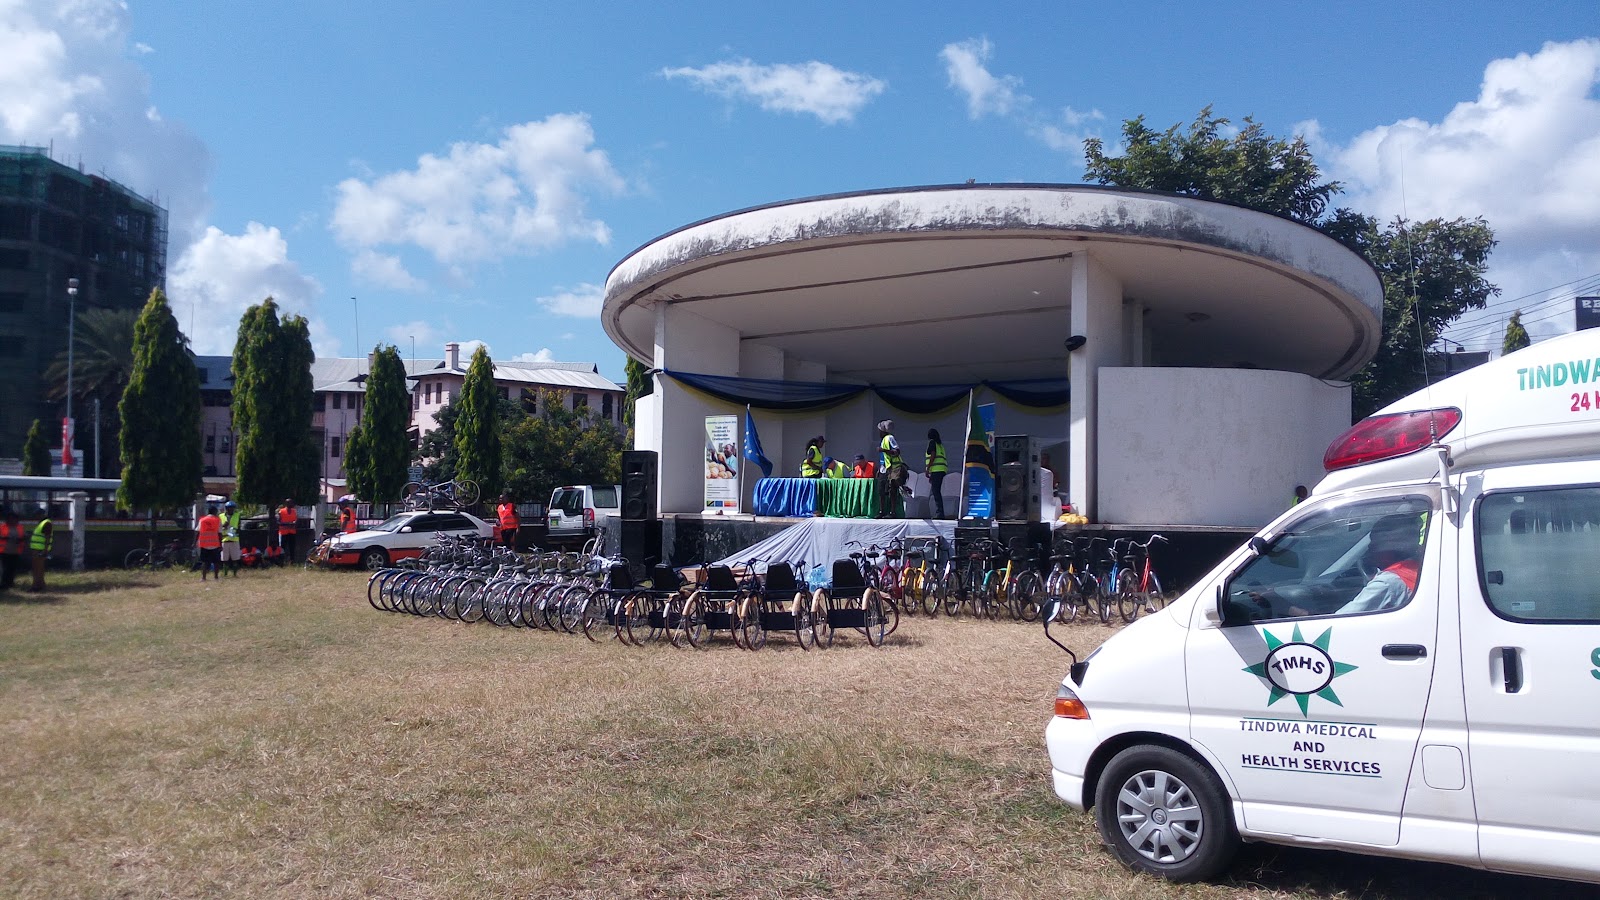
Back at Mnazi Mmoja, while attendees had snacks and water to eat and drink, Mr. Mejah Mbuya, chairperson for UWABA gave a short speech on the importance of using bicycles as low carbon transport around the city. With the fact that Dar es Salaam is much affected by traffic jams, Mr. Mbuya emphasized on the use of bicycles to minimize it.
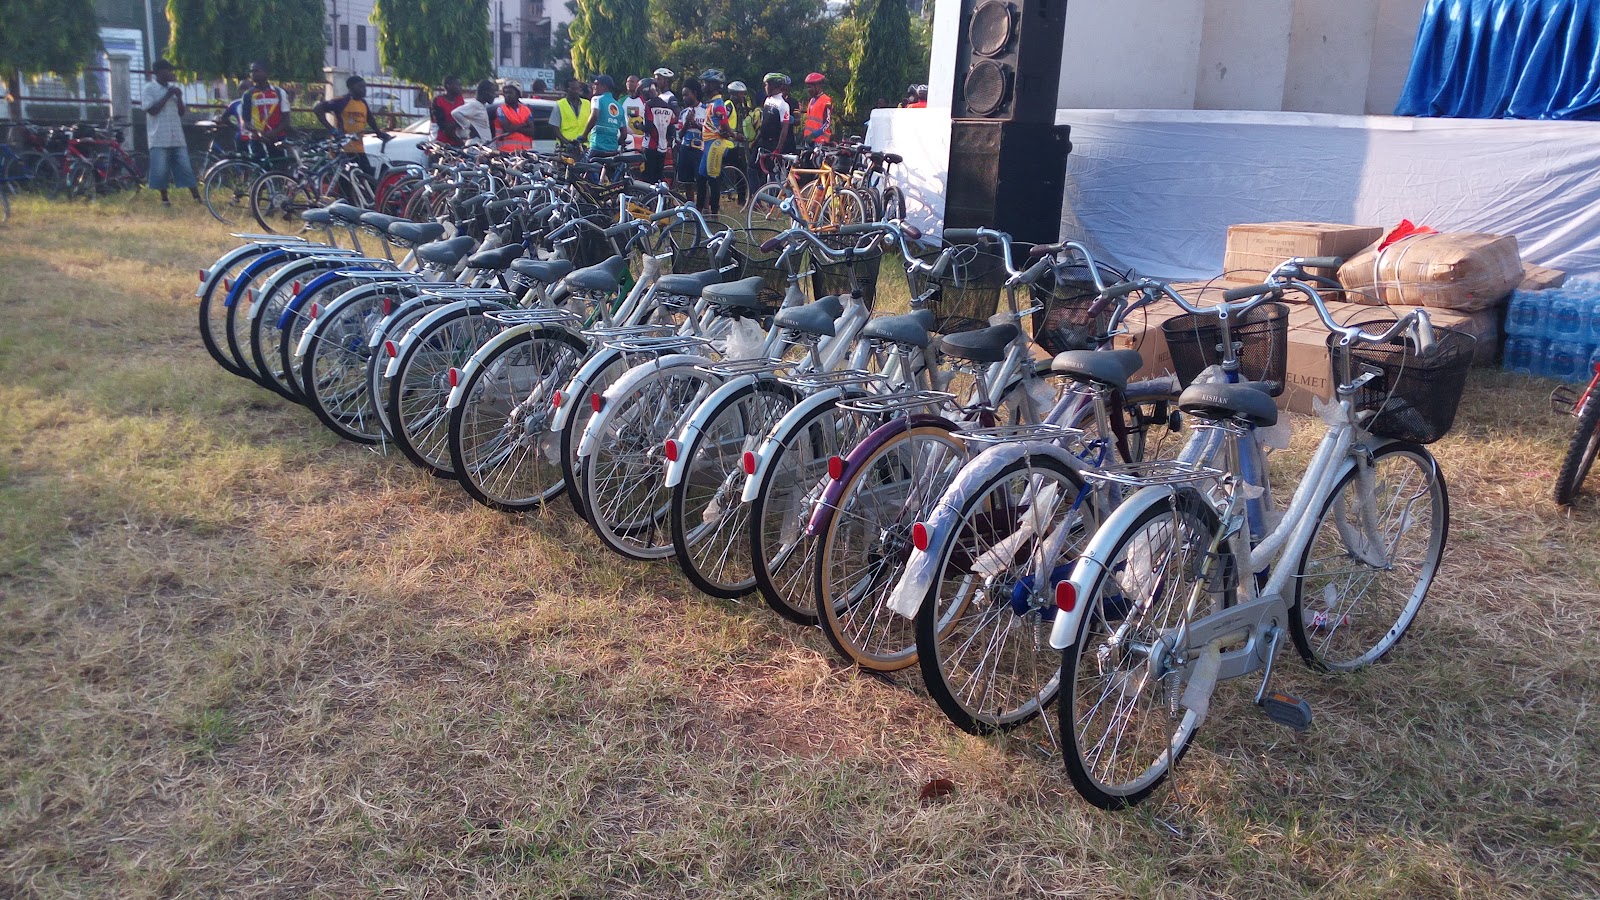
At the end of the event, 5 hand bikes to 5 lucky disabled people, and 15 bicycles were awarded to 15 people who attended the caravan. Unfortunately, no attendee from Ramani Huria team won any bicycle, but did have fun while mapping!
15 bikes for winners
Ramani Huria is looking forward to joining forces with UWABA in mapping and promoting low carbon transport i.e bicycle usage throughout Dar es Salaam.
Ramani Huria was honoured to be part of a recent workshop organised by the Tanzania Red Cross Society as part of their project Zuia Mafuriko (Prevent Flooding). The workshop took place over two days, January 19th-20th 2016, and drew together a variety of stakeholders who play a role in flood prevention in Dar es Salaam. In addition to the Ramani Huria team, participants included members of Community Disaster Preparedness and Response Teams, Kinondoni Municipal council Executive Director, Tanzania Meteorological Agency (TMA), and Ruvu Water Basin Authority. Through the workshop, the various stakeholders shared their experience and supported the development of the Zuia Mafuriko project, including planned activities for Ilala and Kinondoni municipalities.
The workshop was officially opened on January 19th by the Kinondoni Municipal Council Executive. Also present was Nyambiri Kimacha from the Tanzania Red Cross Society and project manager for the Zuia Mafuriko project. She stated that the project will assist in the development of disaster preparedness and response plans for ten wards within Ilala and Kinondoni municipalities. The wards are some of the most flood-prone in Dar es Salaam and include Ndugumbi; Tandale; Buguruni; Magomeni; Hananasif; Mwananyamala; Vingunguti; Kigogo; Manzese; and Mzimuni. Through a partnership with Ramani Huria, the Tanzania Red Cross Society has been able to identify the most relevant wards for the Zuia Mafuriko project and has begun the work with valuable data about the selected areas. The work of Zuia Mafuriko is complementary to that of Ramani Huria, with both working towards providing citizens with data about their communities and improving flood resilience within Dar es Salaam.
Through a presentation entitled ‘Understanding the Weather Forecasts’, Elias Kipika from the Tanzania Meteorological Agency (TMA) gave the workshop an introduction to the wider context of the Zuia Mafuriko and flooding in Dar es Salaam. He stated that there is a limited understanding among the general population regarding weather forecasts, especially when warnings are issued for precautions to be taken. Following his presentation, the attendees discussed some of the challenges of disseminating weather forecast information, including issues arising when people may not have radios or TVs and therefore cannot be reached and informed through traditional communication channels. Elias Kipika acknowledged these challenges and highlighted ways in which his agency has begun innovative approaches, including an SMS service to target agriculturalists. Community members from the wards in which Zuia Mafuriko will operate also shared their experiences of flooding within their communities.
Zuia Mafuriko workshop participants in a discussion session PHOTO CREDIT: Ramani Huria
To conclude the first day, the workshop participants formed five smaller groups of five people for ‘Tough Talk’ sessions. The sessions were designed to facilitate each group to discuss and answer questions within a time limit around flood risk management – to quickly identify issues and opportunities for flood resilience in Dar es Salaam.
A participant presenting the findings of their ‘Tough Talk’ discussion session to the workshop group PHOTO CREDIT: Ramani Huria
At the conclusion of the ‘Tough Talk’ sessions, each group presented their responses to the other workshop attendees. The key findings were displayed on the walls and these facilitated further discussions with other groups.
A workshop attendee presenting their preparedness action plan for when a long-range weather forecast is issued PHOTO CREDIT: Ramani Huria
The second day was focused on the theme of ‘Preparedness action planning’, with attendees developing action plans for when weather forecasts are issued. Three groups of around eight participants assigned either short, medium, or long term forecasts. The groups created a list of actions to be undertaken if their respective forecasts were to be issued, including predicted associated costs, identifying responsible action centres, and expected time for each action. The groups then presented their ideas the rest of the workshop and received feedback on their action points and whether the plans accurately responded to short, medium, or long-range forecasts.
The workshop was closed with remarks on the way forward for the Zuia Mafuriko project. Those present were told that the plans they had created and the issues discussed throughout the workshop would be shared with the Ilala and Kinondoni Municipal Councils as they create their preparedness and response plans. Future workshops will be planned and the project aims to have continued community and stakeholder engagement.
The Ramani Huria team is excited for the future activities of Zuia Mafuriko and our continued partnership with the Tanzania Red Cross Society on flood prevention across Dar es Salaam.
JOSM (Java OpenStreetMap Editor) is a desktop application to conduct mapping activities, the data from which can be added to OpenStreetMap (OSM). It is an open-source editor, written in Java. While initially, the interface may seem daunting compared to some other editors, JOSM offers many features which are extremely useful and isn’t too difficult to master. Another major benefit of JOSM is that mapping can be done offline, unlike with other editors such as iD or Potlatch. This has been very useful when mapping Dar es Salaam as our mappers do not always have a data connection.
Ramani Huria has provided trainings to our student mappers, including training 200 students from the University of Dar es Salaam & Ardhi University. You can view this training material here.
Once downloaded, install and then launch the program. Once loaded you will see the following screen:
JOSM launch screen
Downloading data
Select ‘Download from OSM’ to download map data
Once JOSM has been launched you will need to download data from the OSM servers to edit. From the main menu at the top of the screen, select File then Download from OSM.
Selecting the area to download
After clicking ‘Download from OSM’ a popup dialogue box with then open allowing you to select the specific you would like to download data for. Drag your mouse to select the area you would like, it will be highlighted as a pink box. Once you are happy with the area selected, click the ‘Download’ button at the bottom of the box. Data can also be downloaded from the OSM servers with a URL link. To import this way, select ‘File’, then ‘Open location’ and paste the link.
JOSM with then connect with the OSM servers to download the data layer. When data is downloaded, it will be visible in the central panel of JOSM, the ‘map view’ area (see below). Downloading large amounts of data may take a long time, depending on your internet connection, we recommend working with smaller portions and then when complete downloading another portion.
The JOSM Interface
JOSM interface
Once you have downloaded the data, the full JOSM interface will open up. The following are key elements of the JOSM interface that you should be familiar with:
Map View: the main window where geo-data is displayed and editing is done;
Main menu: the menu from which most functions can be selected, the menu is also customizable depending on the plugins installed;
Shortcut toolbar: a toolbar consisting of shortcuts to commands from the main menu. Highly customizable, menu items can be added or removed from the preference dialog;
Edit tools: contains drawing tools and the show/hide buttons for the Toggle Dialogs window;
Information panels: shows information about data in JOSM including a list of special features, objects, the way in which selected objects are tagged, the last mapper to edit a feature, and different layers in the current view.
Editing data
Data downloaded from OSM servers overlaid with aerial imagery
Once the data has downloaded, select ‘Imagery’ from the main menu and choose the imagery you would like to use, for example, Bing aerial imagery. If available for the area, we recommend mbtiles imagery as it is clearer than Bing aerial imagery.
The data layer will then be overlaid with the aerial imagery. The cross-hatched area shows you the area which is outside of the data you have downloaded from the server.
Selecting layers in JOSM
Layers can be controlled in the layers section of the information panel, including: activating or deactivating the visibility of a layer; changing the layer’s transparency; merging layers; duplicating a layer; deleting a layer.
Navigation in JOSM
While there may be some variations based on your operating system or computer, key navigation in JOSM include:
right mouse button: used to drag the map and navigate in different directions
left mouse button: used to manipulate an element
scroll wheel: used to zoom in and out
Editing tools
The editing tools are found in the top left of of the shortcut bar (on the left of the screen) and here are three main modes of editing: select; draw nodes; delete nodes or ways.
Use the draw nodes (shortcut A) to add new points, lines or polygons, or extend an existing way.
Use select (shortcut S) to select elements, view/edit their tags, and move elements.
Use delete notes (shortcut Ctrl+Delete) or ways to delete selected elements.
Drawing basic elements
In drawing basic elements in JOSM, there are three main types of features that can be created, all of which are created by the draw nodes tool. The three classifications are:
Node: this is a single point which marks a specific location, for example, a shop or mobile money agent location;
Way: an ordered list of nodes connected by line segments, for example, roads, paths;
Closed way: nodes which create a closed-loop to describe areas, for example, buildings, lakes, islands.
When drawing elements, it is also always advised to give the element the appropriate tag (explained further below).
To draw a standalone node:
Clear your current selection, this can be done by the shortcut key ‘Esc/Escape’
Select ‘Draw Nodes’ (shortcut A)
Double click in the map view the location the node should be located
Return to ‘Select’ and select ‘Presets’ then ‘Tags’ to tag the element, for example, if it is a kiosk, select Presets > Shops > Food > Kiosk. Additionally, tags can be searched by selecting Presets > Search Presets, or using the shortcut F3.
To draw away:
A way consists of several nodes, once you have selected one node, click again in the map view to create a second node
Continue to click in the map view to create a number of nodes which will form a line
To finish, double click on the last node of the way or press ‘Esc/Escape’
Tag the feature in the same way as for a node, for example for a residential road select Presets > Highways > Streets > Residential
To draw a closed way:
Click on the map view where the polygon will begin
continue to click to create the shape of the polygon – note that a closed way should be a closed area
to finish, click on the first node of the way – this will close the area being drawn
Tag the feature, as above, for example for a residential building select Presets > Man-made > building. For this type of tag, an additional pop-up window will open to add additional information on the building, including the type of building, name of the building, and height of the building.
Tagging
Example of tags, showing both keys and values
Tags describe data in OSM and are attributes that label basic elements (nodes, ways, closed ways). A tag is composed of a key and value. A key is a label that gives the general classification of the feature, the value gives more specific information. Both the key and value are always in lowercase and do not include spaces if space would normally be used and underscore is used instead.
Tags are displayed on the right-hand side of the screen under ‘properties/memberships’. When you select an element, a table will appear in this area showing both key and value fields.
Features may have multiple tags. It is advisable to add all relevant tags to any element you create as this will improve the quality of the data you upload and assist other mappers.
Presets
Select presets from the main menu to label element
Presets are tags that are ‘human-readable’ and allow elements to be labelled from a predefined menu. To do so, select presets from the main menu and choose the preset labels that match your element.
Uploading data to OSM servers
Once you have created/edited/deleted and tagged all features in your downloaded data, the amended data can be uploaded to the OSM servers.
Log in with OSM username & password
Log in to JOSM by selecting Edit > Preferences > Connection from the main menu. Input your osm_id (OSM username) and password, then click OK.
Uploading data to OSM
Once logged in, select File > Upload data (shortcut Ctrl+shift+up) from the main menu. A pop-up menu will list the data to be uploaded and ask you to provide comments on the changes, for example, ‘Community mapping for flood resilience – Sinza’, and specify the source for changes, for example, Bing aerial imagery. It is always wise to add specific information about the changes you have made to assist other mappers and improve the quality of the data.
To upload, click ‘Upload changes’ and your data will be uploaded to the OSM servers. When the upload is complete, you will be notified with the message ‘Upload Successful’ – don’t close JOSM until you have received this confirmation.
Congratulations, you have now contributed to OpenStreetMap by using JOSM!
Learn more
JOSM is a very powerful tool and used by experienced mappers as well as beginners. To learn more about the many features and tools available through JOSM see the JOSM section of ‘Learn OSM’.
If you have questions about using JOSM the Ramani Huria team is always happy to help. We support monthly Maptime Tanzania events where we often provide additional training on JOSM. Get in touch with us or come along to our next Maptime Tanzania event to learn more or get specific help.
There are many data collection tools you can use to gather the information required to make maps, depending on your needs and resources. Working in Dar es Salaam, the Ramani Huria team have developed a systematic approach to collect data from a variety of sources and allowing us to have develop accurate & sophisticated maps. In this how to blog post, we will give you information about the tools we use specifically to map flood-prone wards of the city and the collection of data for flood resilience. All the data collected with these tools is shared on OpenStreetMap (OSM).
Data collection tools are the instruments and devices used to aid the process of gathering data and it’s vital for our mapping process that these tools can capture the information required, be usable by our mappers, and perform in the daily environment of Dar es Salaam. Our mappers, students and community members, use a range of tools including:
stand alone GPS devices
field papers
note taking i.e. pen and paper
mobile apps including OSM tracker
Together these tools allow us to collect the information we need and produce useful maps for the communities we work in. Many of these tools are accessible for anyone to use and we’ll tell you a bit more about how you can use them to create maps.
Stand alone GPS devices
GPS stands for Global Positioning System, a satellite-based navigation system made up of a network of satellites that function in any weather conditions, anywhere in the world, 24 hours a day. Put into orbit by the U.S. Department of Defense GPS was originally intended for military applications but has become available for civilian use. By receiving signals from satellites orbiting the earth, GPS calculates your exact location and provides it in coordinates of two numbers: longitude (how far west or east you are) and latitude (how far north or south you are). We use GPS devices with Ramani Huria because they are highly accurate and very simple to use by our mappers, regardless of experience. There are also small and lightweight making them easy to use wherever our mappers are in the city.
Ramani Huria mappers using a GPS unit in Ndugumbi ward PHOTO CREDIT: Ramani Huria
There are a range of GPS units that you can use and they function in much the same way. The units used by Ramani Huria are similar to those pictured above and allow our mappers to easily navigate their location.
How to use a GPS unit
Ramani Huria uses Garmin GPS units, here’s a guide using the tool in your mapping.
Turn the unit on by pressing the lower button on the right hand side labelled ‘light’. Once the device is turned on, it will start receiving satellite signals.
Using the joystick, navigate through the menu and select ‘Satellite’. A new window will pop up which will tell you the accuracy of the GPS unit and your current position. Ideally your accuracy should be 5-3 metres, you may need to stand still for a little while for the accuracy to improve.
Freely move around as you collect information and whenever you would like to take a point of reference or save a location, select ‘Mark Waypoint’ from the unit’s menu. The GPS unit will save the location. By default the locations will be numbered but you can also customise the name of the location. For later reference, it’s also a good idea to write down in a notebook the name and tags of any waypoints you save.
A series of locations that you move through, creating a path, are called tracks. You can also save these on your unit. Tracks are useful for mapping objects that are represented by lines or shapes, for example roads, drainage systems, or the shape of a field. As part of gathering information for flood resilience, Ramani Huria is mapping drainage systems, so this feature has been especially helpful for us. To see or edit your tracks, select ‘Track Manager’ and you will see both your current track and any other tracks you have saved. Click ‘Current Track’ to save your track, you can give it a custom name or leave it with the default name. Always ensure you save your tracks when you finish mapping an area!
When you have finished mapping, ensure you turn off your device by pressing the ‘Light’ button. It’s important to turn the device off so that it does not continue to track your movements after you have finished data collection.
When you have finished data collection, it’s important to make this information usable, for example Ramani Huria uses JOSM to add the data collected to our maps. To do this:
connect the GPS unit to a computer/
wait for the computer to detect the device and display the files, for example, with the device above you will see a file name ‘Garmin’. Double click and you will see several files stored on the unit.
Click on the file ‘GPX’ and this will display your saved waypoints and tracks you have collected.
Once you have JOSM open, select ‘File’, then ‘Open’, and the choose the waypoints and tracks to import them into JOSM.
We will be releasing a ‘how to’ post on JOSM soon, but in the meantime, check out the official guide.
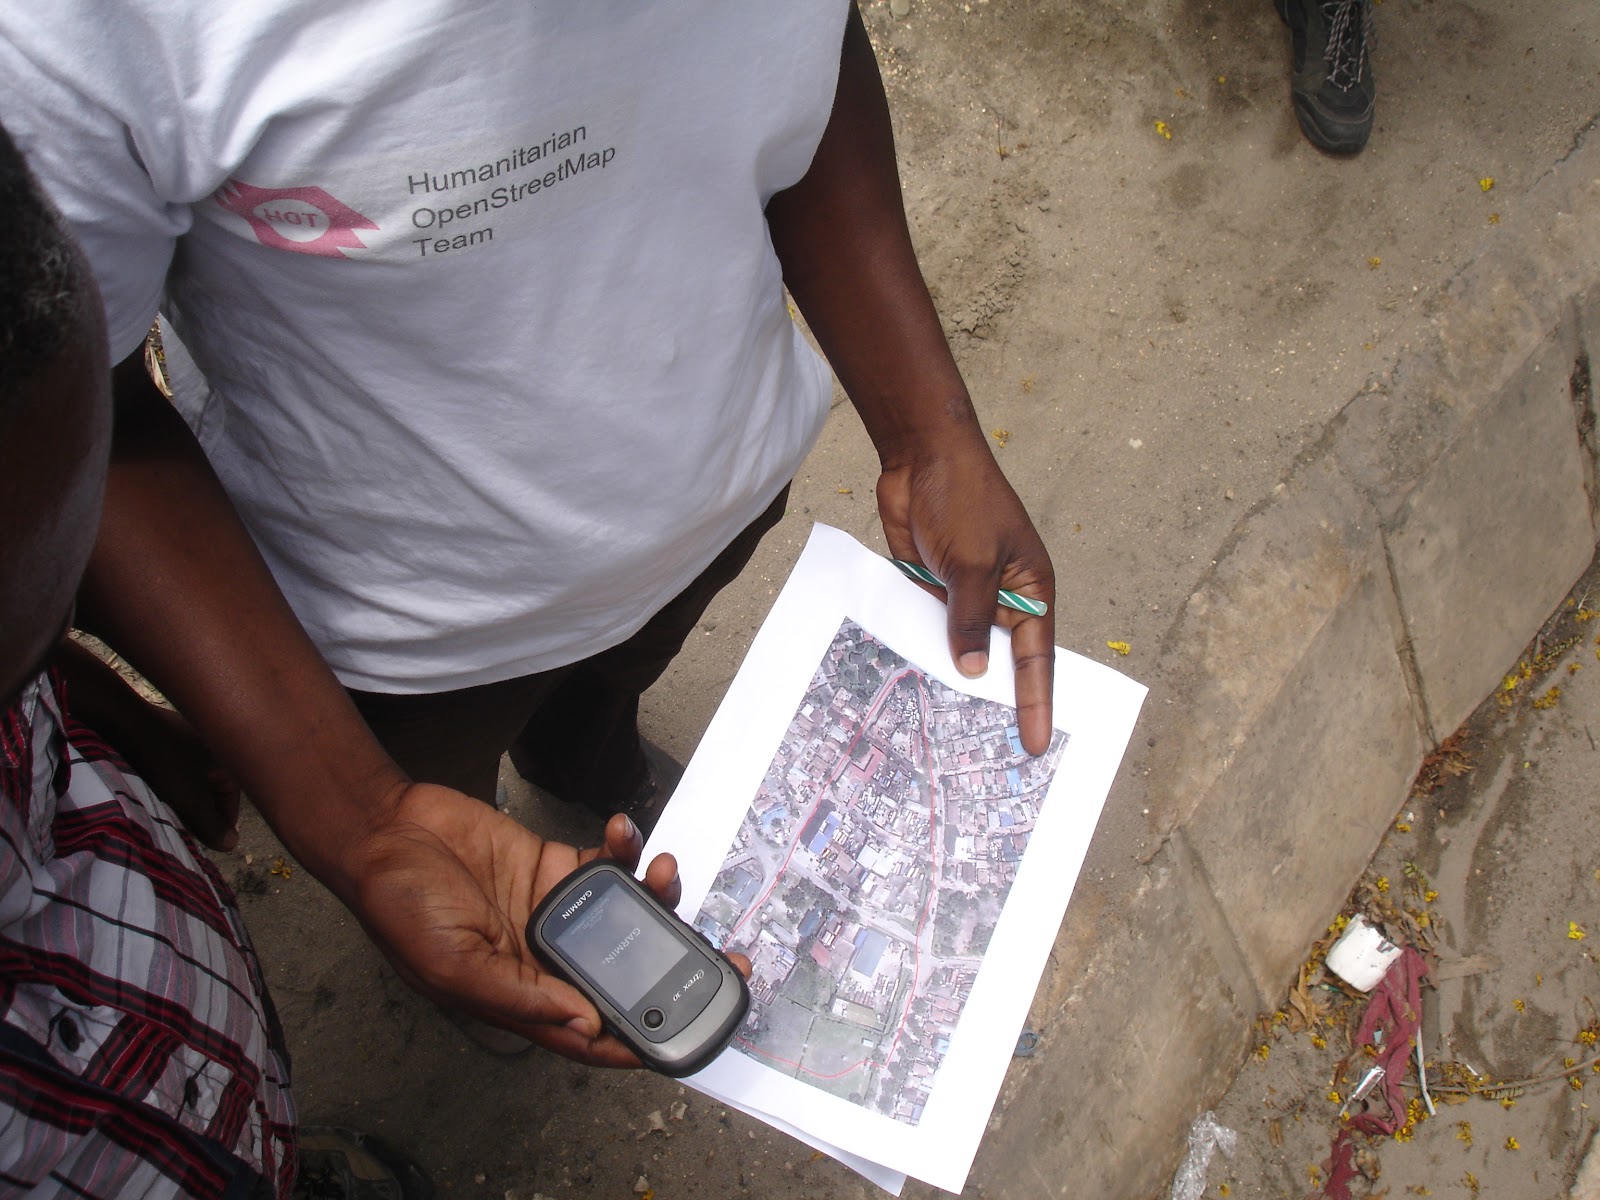
Field papers
Field papers are pieces of paper that allow you to easierly gather data while in the field by printing a map of an area, drawing on it and adding notes, and then loading the paper back to JOSM before adding the locations to OpenStreetMap.
The Field Papers website allows anyone to create a multipage atlas of anywhere in the world. Ramani Huria is mapping the city of Dar es Salaam ward by ward but in order to allocate mapping tasks, we divide the ward into workable portions. With the assistance of GPS units, this ensures our mappers know exactly where to map in the field and makes the process very efficient.
A mapper with field paper and GPS unit PHOTO CREDIT: Ramani Huria
How create field papers
Using the Field Papers website, you can create field papers for anywhere in the world, perhaps you want to map your neighbourhood and upload it to OSM or maybe you’re visiting a new city. Here’s how to create your own:
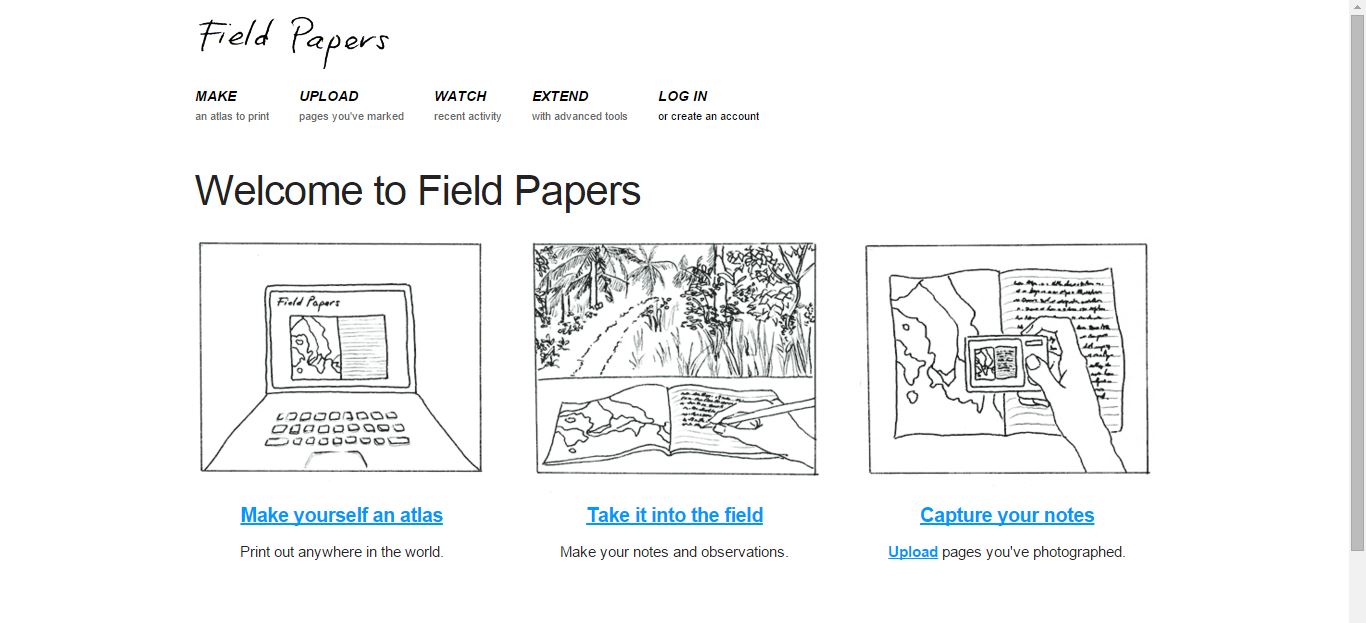
Start by selecting MAKE or ‘Make yourself an atlas’
Go to the Field Papers site: http://fieldpapers.org/. Creating an account is option but it’s a good idea if you would like to save the field papers you create online.
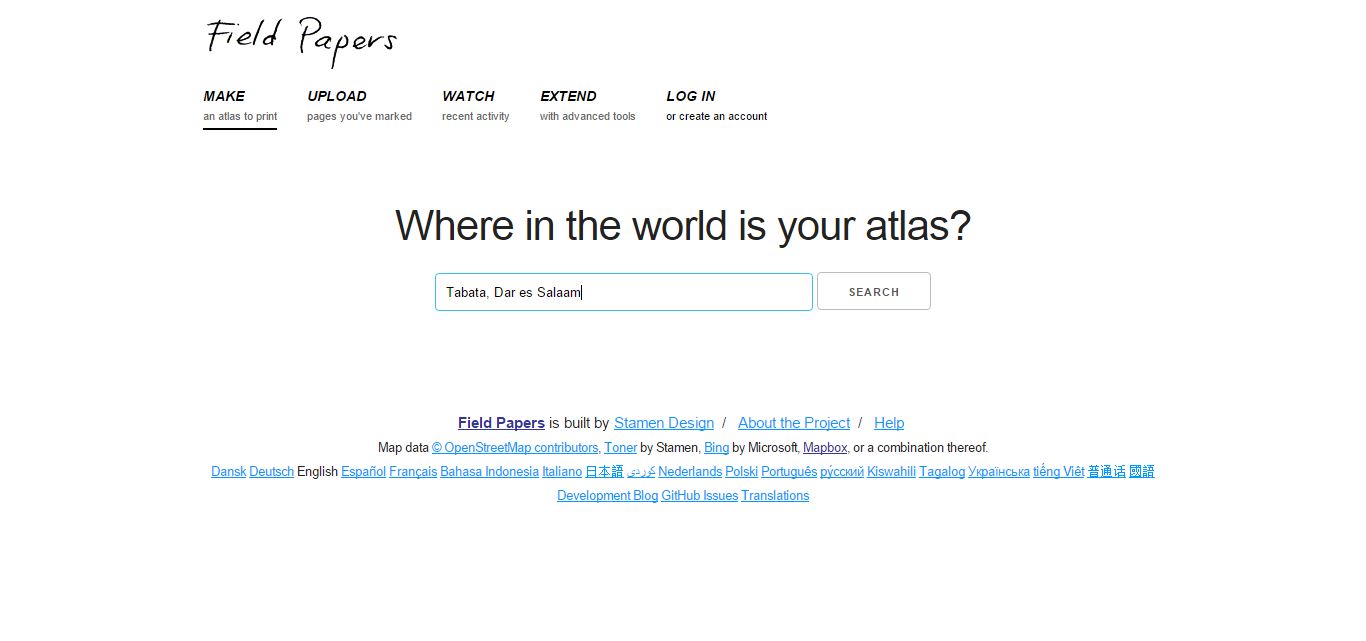
Select the first option in the menu, ‘MAKE’ or click ‘Make yourself an atlas’. The next window will ask you ‘Where in the world is your atlas’.
Select the area you are interested in
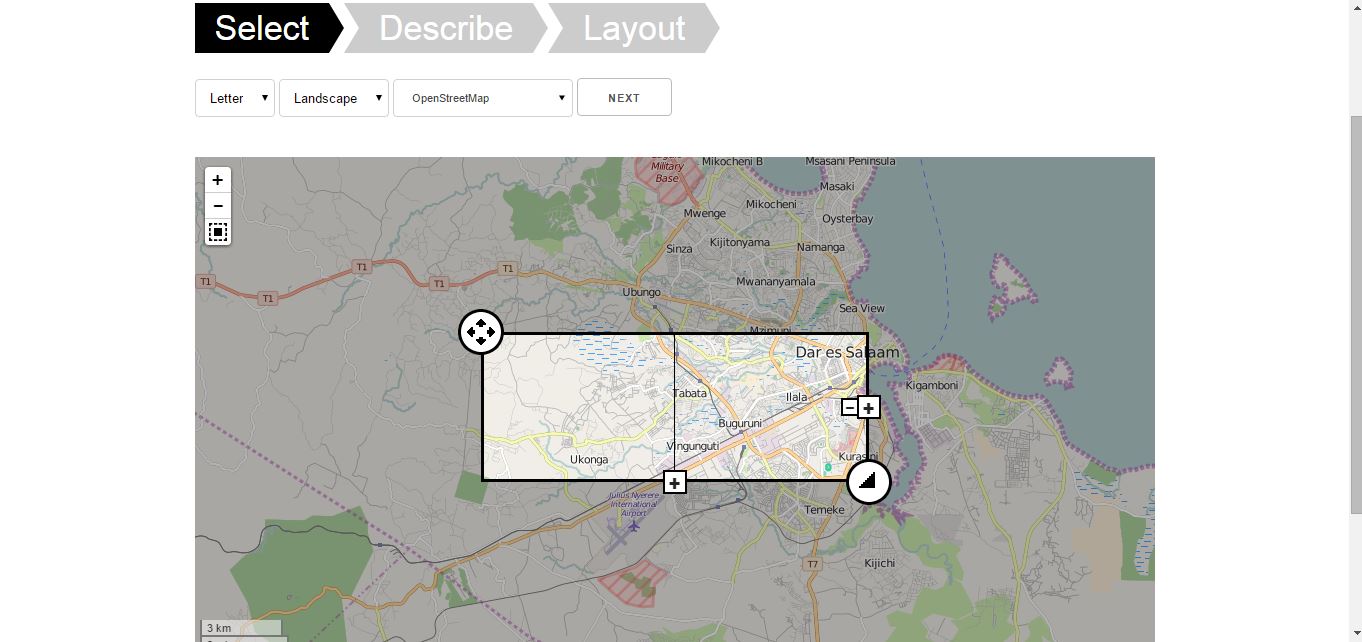
The next page will show the area you have requested on OpenStreetMap. Use the tools to select the specific area you would like. The buttons are as follows:
this tool moves the area selected on the map
this tool increases or reduces the coverage of the area you have selected
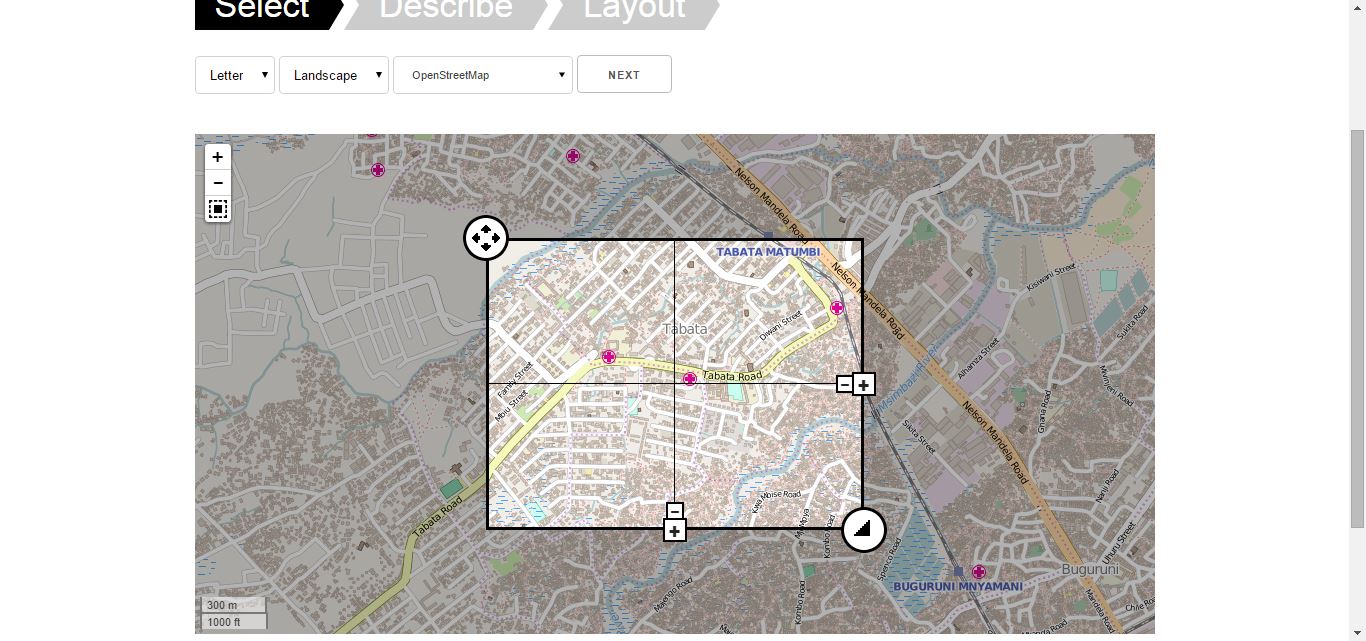
this tool reduces or adds the number of portions the area is split into, make sure you create a reasonable number of potions based on the atlas you are creating i.e. the map should be split into enough portions that is clear and usable
the top two buttons zooms in (+) or out (-), the bottom button centers the portions on the screen
Default settings for creating field papers once you have selected your area to map
4. You will see three tabs above the map, ‘Select’, ‘Describe’, and ‘Layout’. You will initially be on the ‘Select’ option giving you three elements to define from drop down lists.
‘Letter’ allows you to set the paper size, either A3 or A4. Most standard printers use A4 and this is also a more user friendly size for mapping in the field.
‘Landscape’ means that the portions will be wider than they are tall. If you would prefer ‘portrait’ (portions taller than they are wide), you can change this option from the drop down.
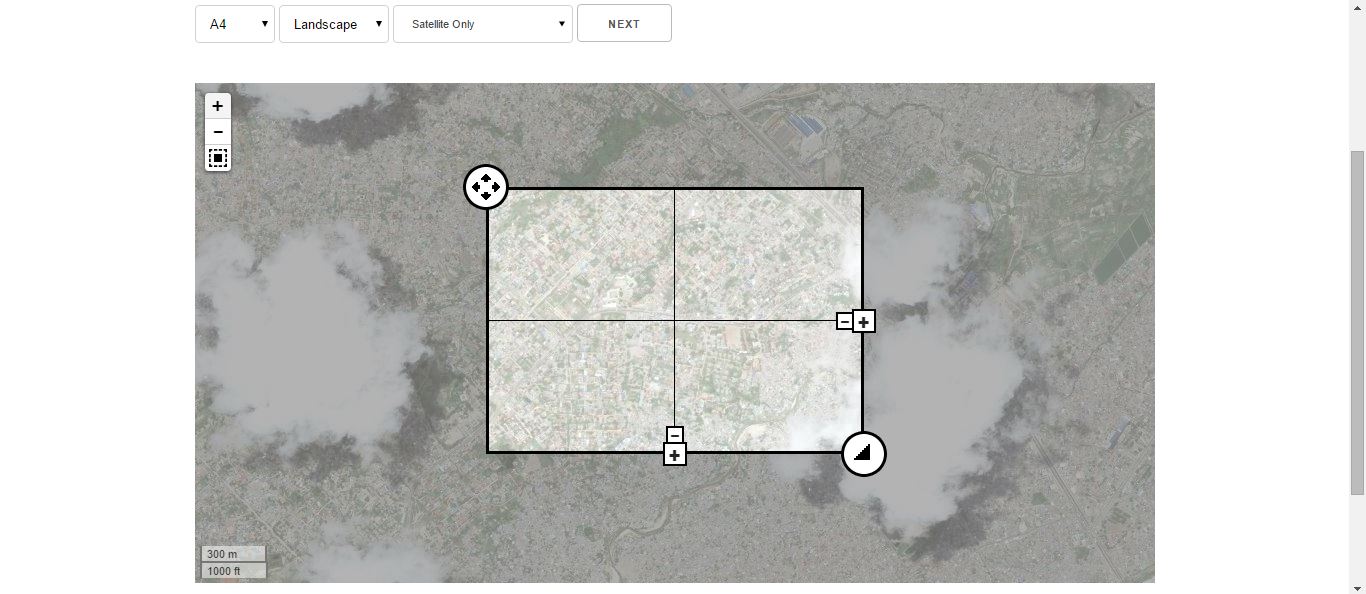
‘OpenStreetMap’ is the default option for source of the field papers. You can also select other options such as ‘black and white’ or ‘satellite’. Select the appropriate option for your mapping needs. For mapping conducting by Ramani Huria, we use satellite imagery so select ‘Satellite only’.
Once you have selected the appropriate options, click ‘Next’.
These settings will produce 4 landscape A4 field papers from satellite imagery
5. After clicking ‘Next’ you will go to the ‘Describe’ section which will allow you to name the atlas. You also have the option to make the atlas as private if you do not want it to be publicly viewable.
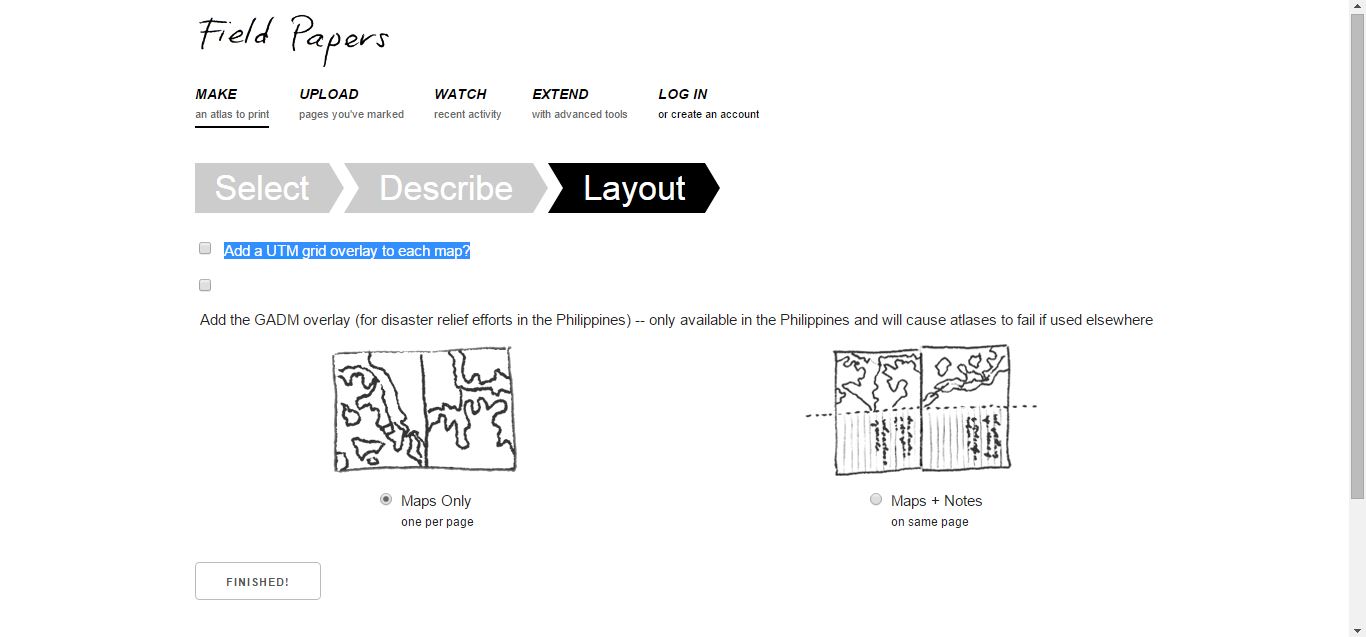
Selecting ‘Layout’ options
6. Clicking ‘Next’ again will take you to the ‘Layout’ tab. You can choose to add a UTM (Universal Transverse Mercator) grid and choose to either create ‘Maps Only’ (a full page map) or ‘Maps + Notes’ (a half page map with notes on the rest of the page). When you have selected your options, click ‘Finished’.
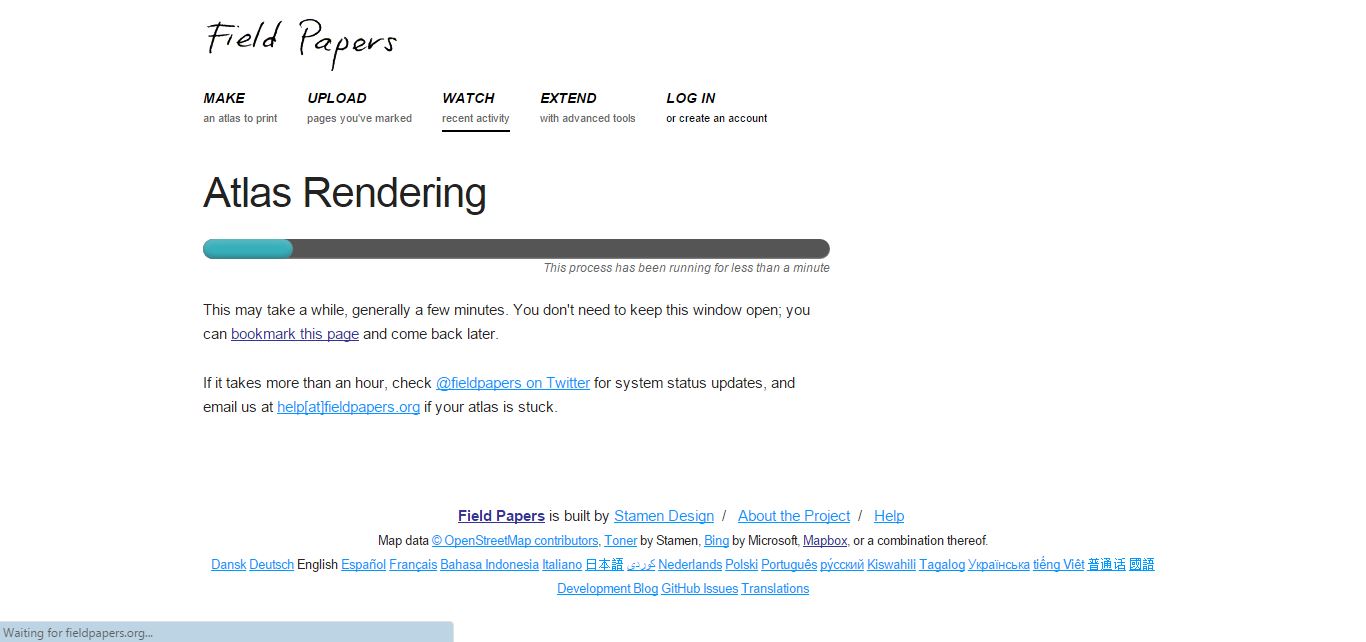
Rendering the atlas
7. Your atlas will then be rendered, and when completed a window will pop up. This window will show the portions you have created with imagery, with each portion having a unique label e.g. A1, A2, B1, B2. In the top left corner you will see the name of the atlas and the number of papers created. To save the papers, click ‘Download PDF’ in the lower right corner.
8. Your downloaded PDF will included overview information about the atlas as well as all the field papers you have created. You can either print the papers or keep them digital and use the filed papers to assist in data collection in mapping!
Note taking i.e. pen and paper
Note taking with pen and paper is always a useful compliment to any data collection tools. Mapping in Dar es Salaam Ramani Huria has found that pen and paper can also be very useful when there is no power, signal, or other tools run out of battery.
We advise creating and using data collection forms to gather additional data as you map, this can help you remember details of features you are mapping and is more efficient than noting all details in a GPS device, which can take a lot of time.
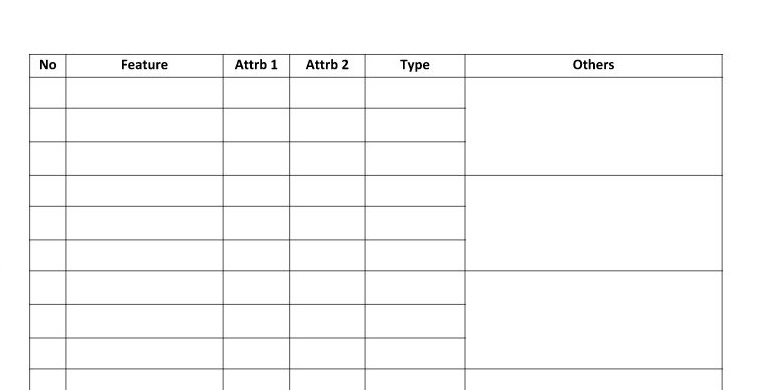
Sample of data collection form SOURCE: Ramani Huria
Above is an example of a data collection form Ramani Huria mappers have used. Before you begin mapping, be clear about what information you are looking to gather and design your form to assist you in capturing this information.
Mobile apps, including OSMtracker
There are a number of mobile applications that can assist you in data collection when mapping, one example used by Ramani Huria is the OSMtracker. This works similar to a GPS device and is designed to be a tracking tool for OpenStreetMap. This app requires GPS on your phone to be turned on and to have a working data connection while using the app.
The app is available for Android or Windows Mobile. Once you have downloaded the app, launch it and begin creating your first track.
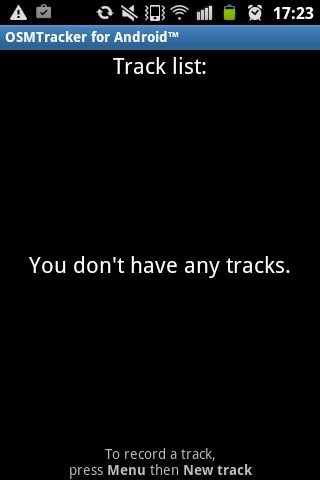
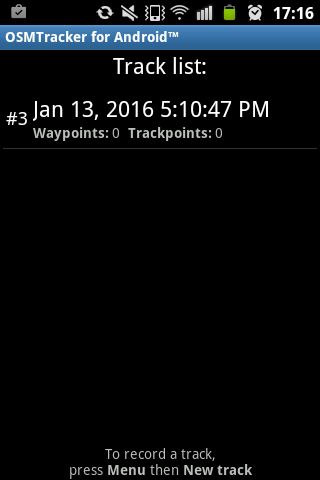
Tracks, click ‘New track’ to start mapping
To start mapping, click ‘New track’. Your phone will ask you to enable GPS, this is required to collect data. Once enabled you will see a variety of options including a network signal bar, you may need to wait for this to turn from red to green, indicating the GPS has picked up the network.
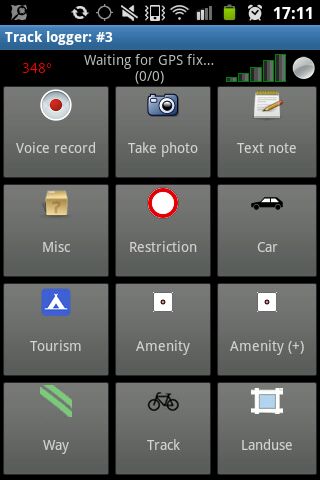
OSMtracker menu on Android
As you move around the app will track your movements and from the menu you can select a number of options to add notes, for example take a photo, record audio, or make a text note. All of these notes will be geo-referenced and when uploaded show in JOSM exactly where the information was recorded. You can also add in information about features and waypoints.
Track list once stopped and saved tracking
While you are tracking, click ‘Stop & Save’ to return to the homepage. You will see the track you have just done (and any previously saved) listed.
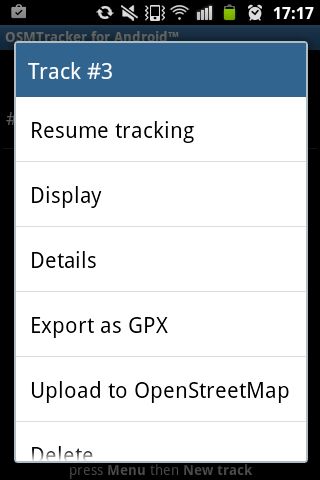
Track options
Clicking on the track will give you a number of options including ‘Resume Tracking’.
When you have finished data collection in the field and are ready use your data, select ‘Export as GPX’ to make the information readable by JOSM. You can also share the data collected directly to OpenStreetMap.
Once you have exported the data as GPX, connect your phone to the computer. Once connected, located the OSM tracker file on the phone and copy to your computer.
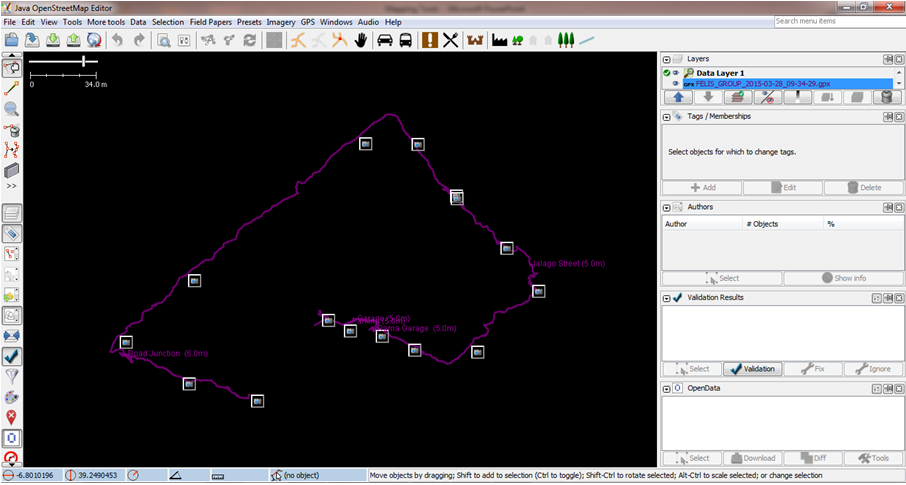
Data collected by OSMtracker exported as GPX and imported to JOSM
After launching JOSM, you can open the tracks you have created, as well as any additional notes you saved while mapping. These notes are especially helpful in digitisation.
Start mapping!
Now that you know more about data collection tools you’re ready to start mapping! Make sure you share your data on OpenStreetMap and contribute to the biggest community driven map of the world.
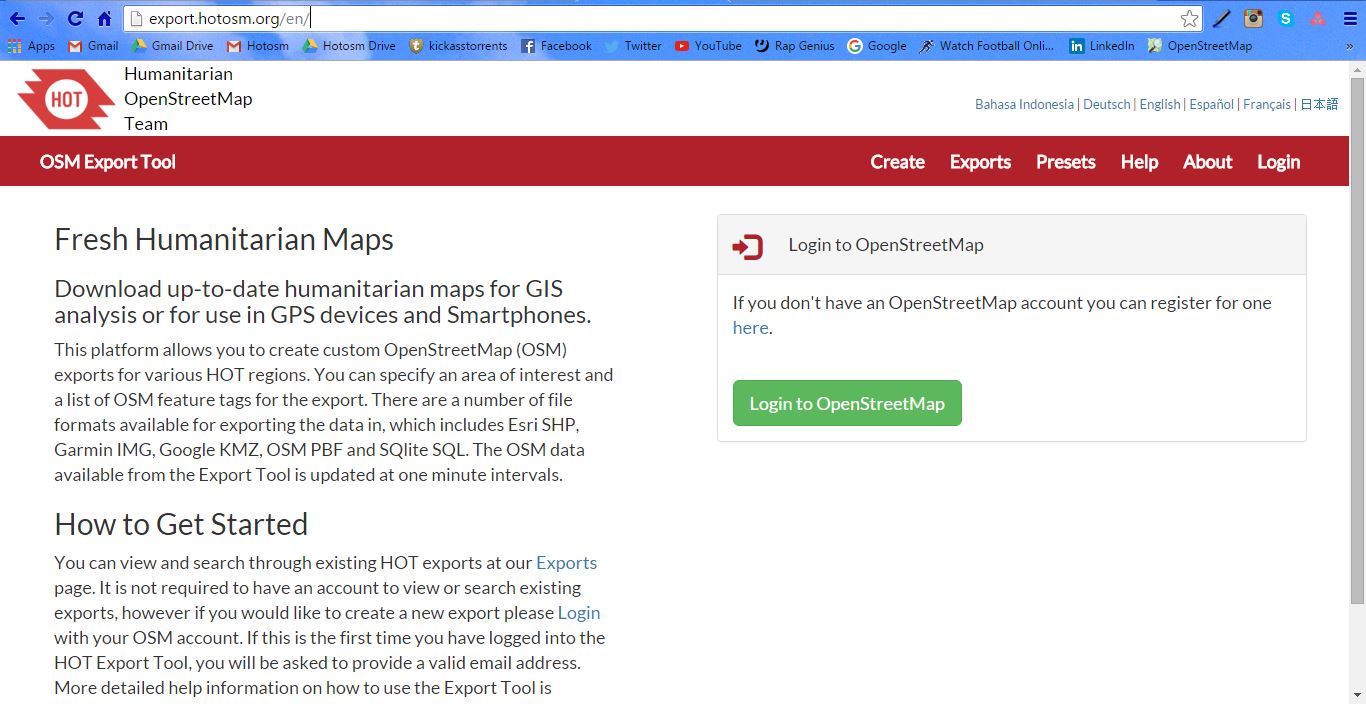
The HOT Export tool is a tool created by Humanitarian OpenStreetMap Team (HOT) that allows you to create custom OpenStreetMap (OSM) exports, you can download up-to-date maps for GIS analysis or use in GPS devices and/or smartphones. The OSM data available from the tool is updated at one minute intervals so very accurate and a number of file formats are available for exporting data in, including Esri SHP, Garmin IMG, Google KMZ, OSM PBF and SQlite SQL. Some of the features include the ability to:
create customized maps with tags and markers
translate maps into different languages
upload, update and utilize existing data files created by others with the Visual Tag Chooser application to help customize your map
convert OSM maps into other mapping programs using the structured query language (SQL) option
save and access your customized maps for later use by creating a personalized account
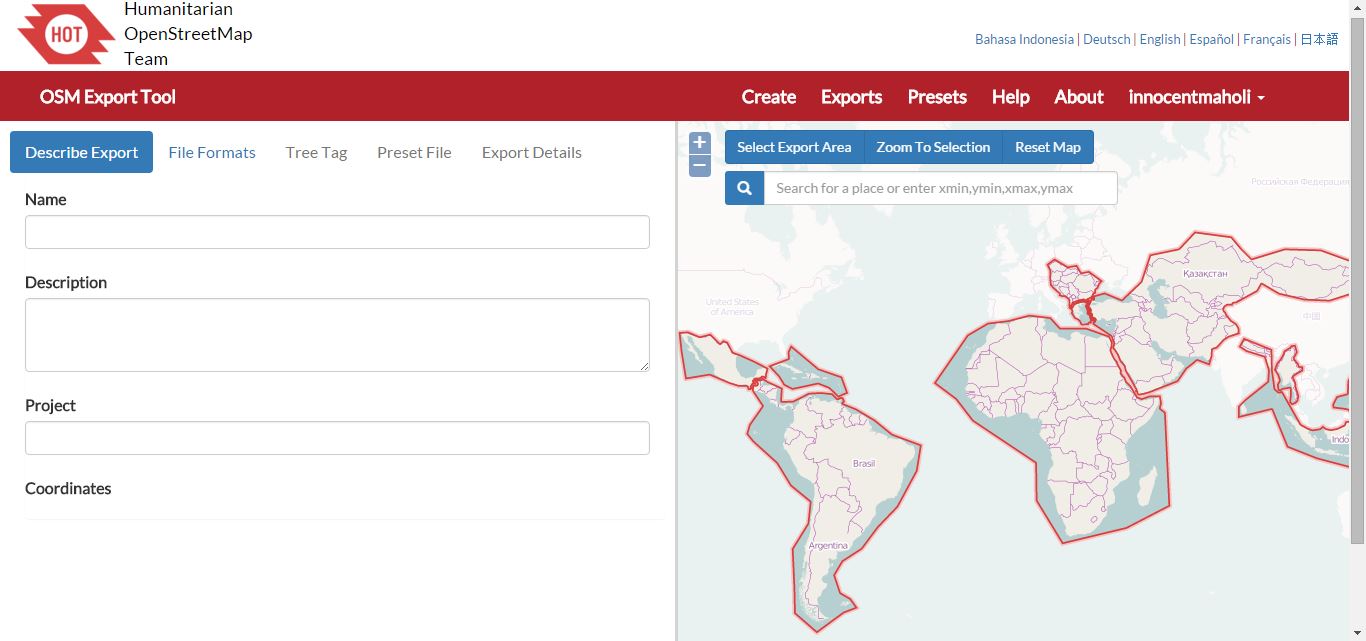
To use the Export Tool, you must first have an OpenStreetMap user account. Log in to OpenStreetMap, or if you don’t have an account you will be prompted to create one. You will be asked to grant access and approve your account by verifying your email address.
Creating an export
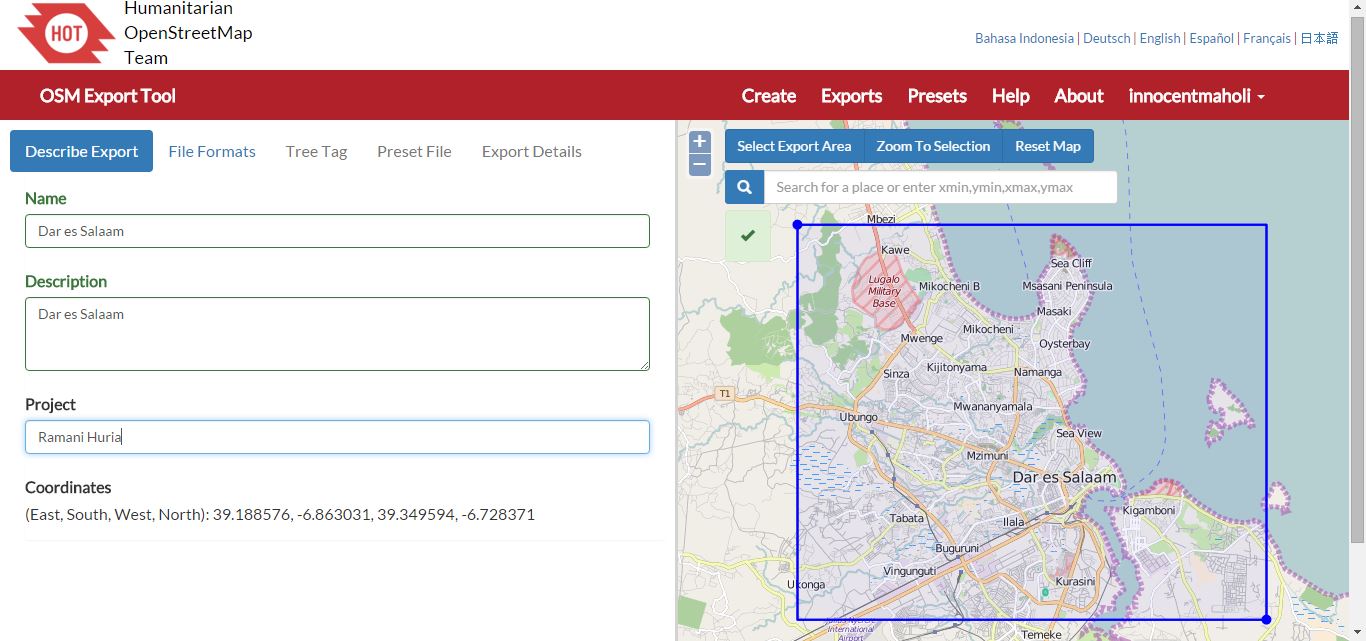
On the left hand side of the screen, give the export a ‘Name’, ‘Description’, and name the ‘Project’ to reference your export, this will help you and others know what is included in the export.
Describing your export and selecting your export area
On the right hand side of the screen, select the export area. You will initially see a world map which you can zoom in (+) or out (-) of. Click the ‘Select Export Area’ button and select the area you want by clicking and holding down the mouse button – creating an area that covers your area or interest. You can adjust the size of the area by dragging the top-left or bottom-right corners of the box and you can move the entire box by holding down the mouse button and dragging.
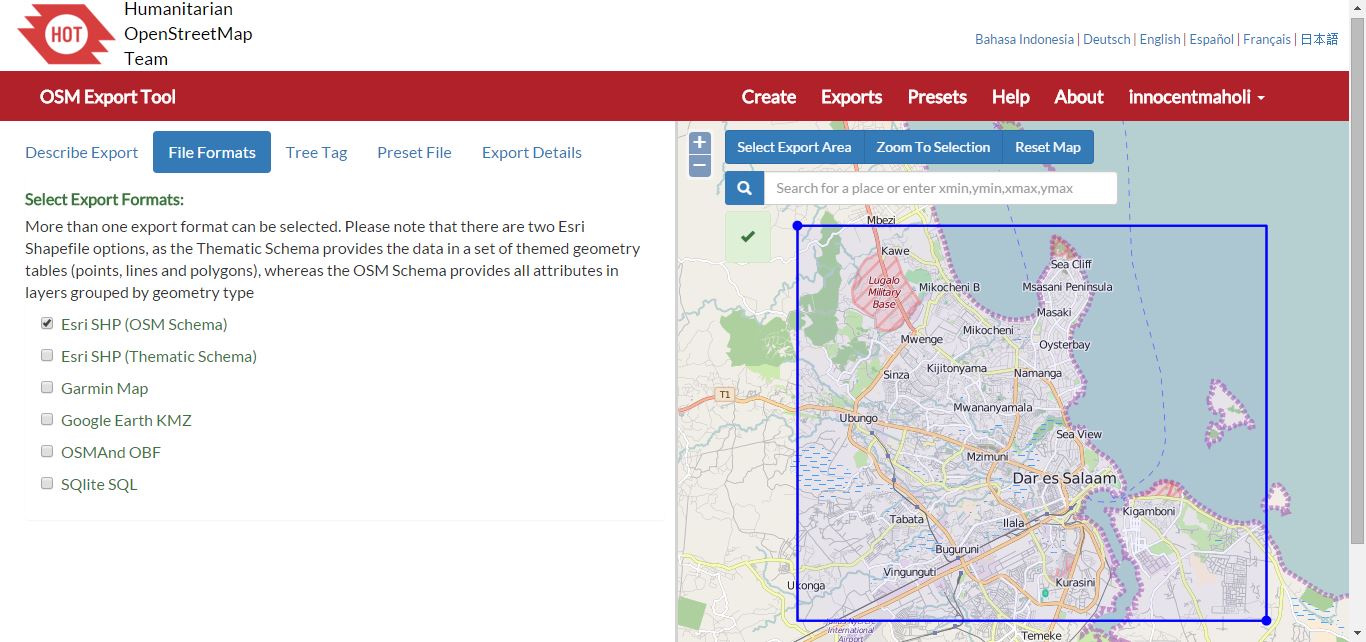
Selecting export formats
Once you have selected your area to export, and lablled as needed, click ‘File Formats’. You are then provided with a variety of file formats to export to including: Esri SHP (OSM Schema), Esri SHP (Thematic Schema), Garmin Map, Google Earth KMZ, OSMAnd OBF, and SQLite SQL (for more information on these formats see HOT Export Tool: File Formats). You can select more than one option when exporting. Ramani Huria primarily uses the tool to create shapefiles, so in this example, select Esri SHP (OSM Schema) to get shapefiles in OSM format.
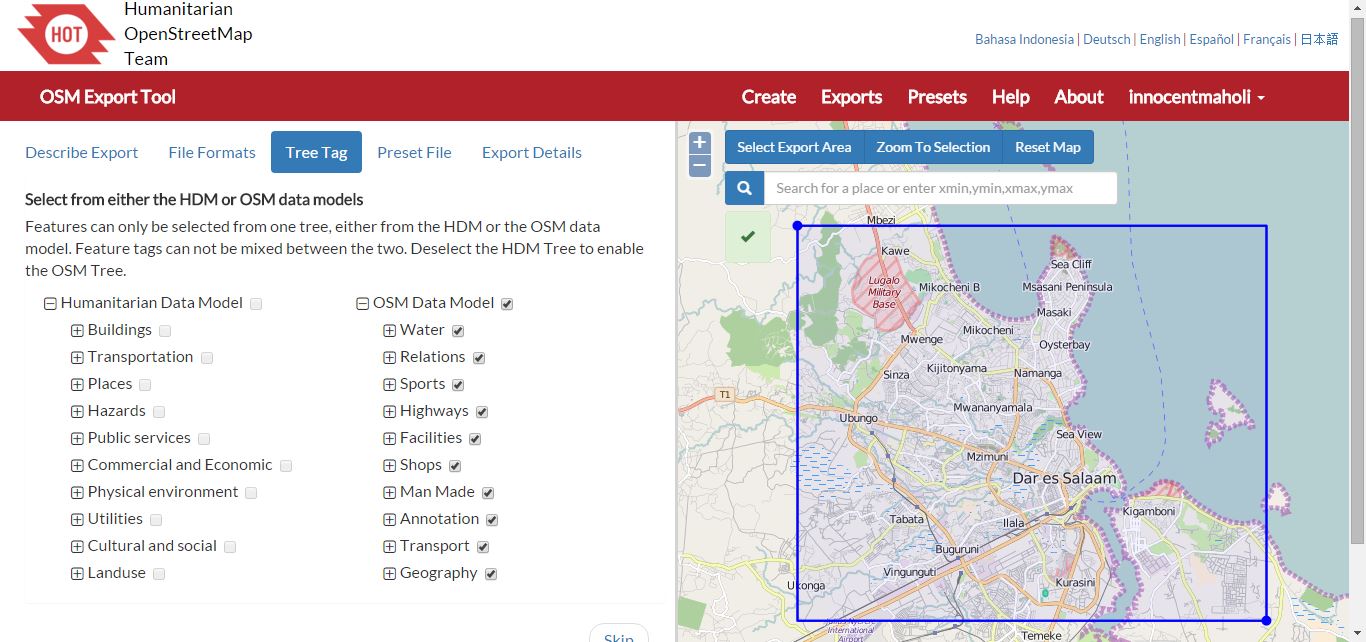
Tree Tag options
The next section ‘Tree Tag’ allows you to choose features to be included in the export. You can select features from either Humanitarian Data Model (HDM) or OSM data model. You can only select from one tree i.e. one model, and feature tags cannot be mixed between the two. For this example, deselect the HDM tree and enable the OSM tree, all features will be automatically selected.
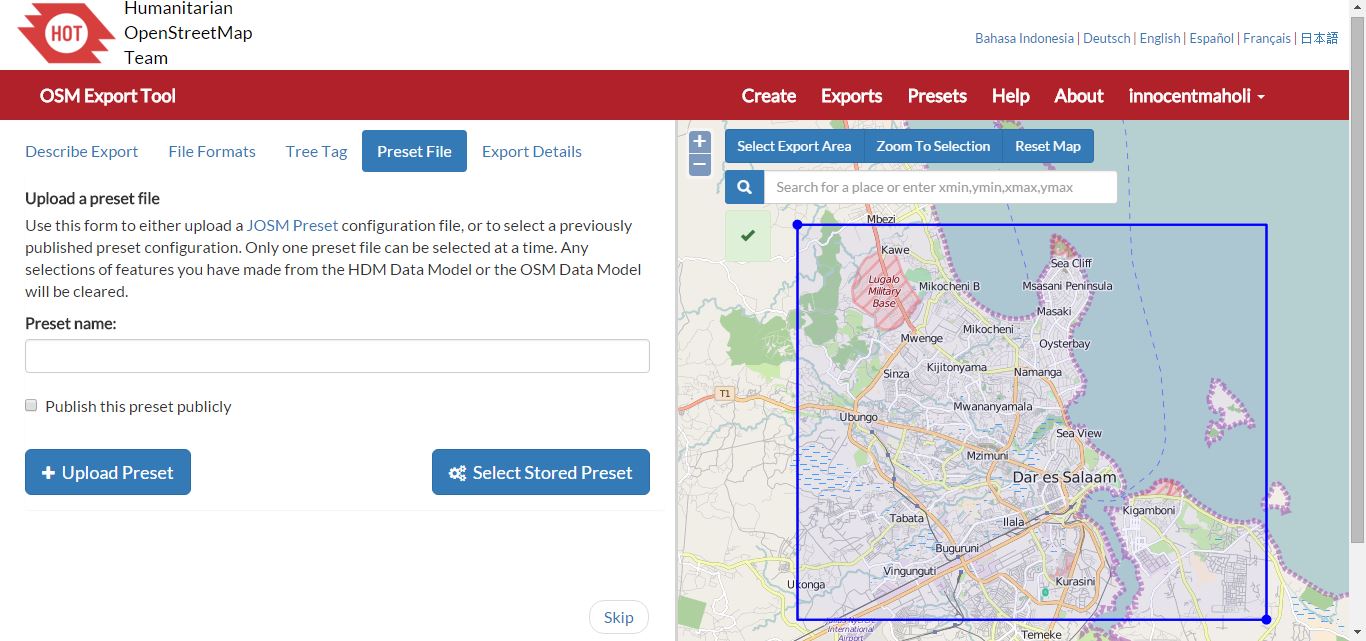
Uploading a preset file or selecting a stored preset
The next tab, ‘Preset File’ allows you to upload a JOSM Preset configuration file or select a stored preset. Using presets are particularly helpful if you are creating more than one export. By adding a preset file, any features selected from the HDM or OSM Data Model will be cleared. Ramani Huria uses a preset, which is freely available for anyone to download from our GitHub account. To try using the Ramani Huria preset as your preset, download and unzip the file ‘Dar es Salaam.zip’ and located the file ‘RamaniHuria.xml’. You must give the preset a name, then click ‘Upload Preset’ and locate the file.
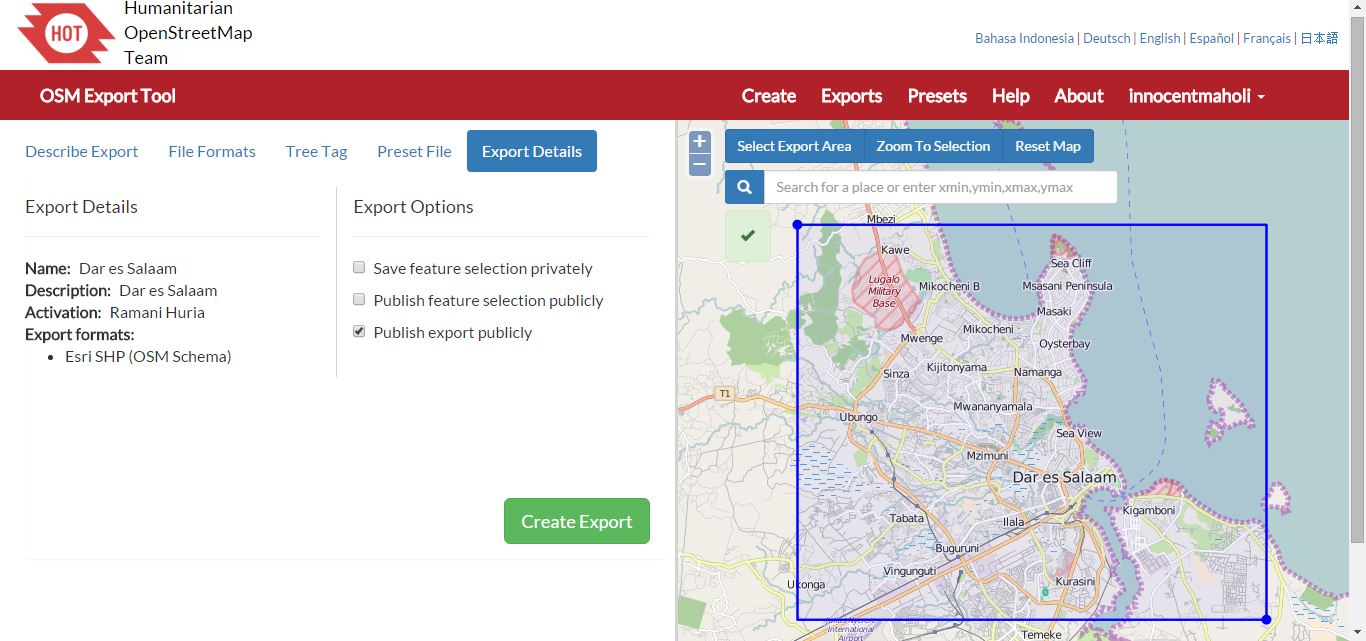
Export details
The last tab, ‘Export Details’ allows you to see additional information about the export. You can go back and make any required changes, for example add a file format to export. Depending on your export settings you may have the options to: ‘Save feature selection privately’, ‘Public feature selection publicly’ and/or ‘Publish export publically’.
When you have finalised your selections click ‘Create Export’.
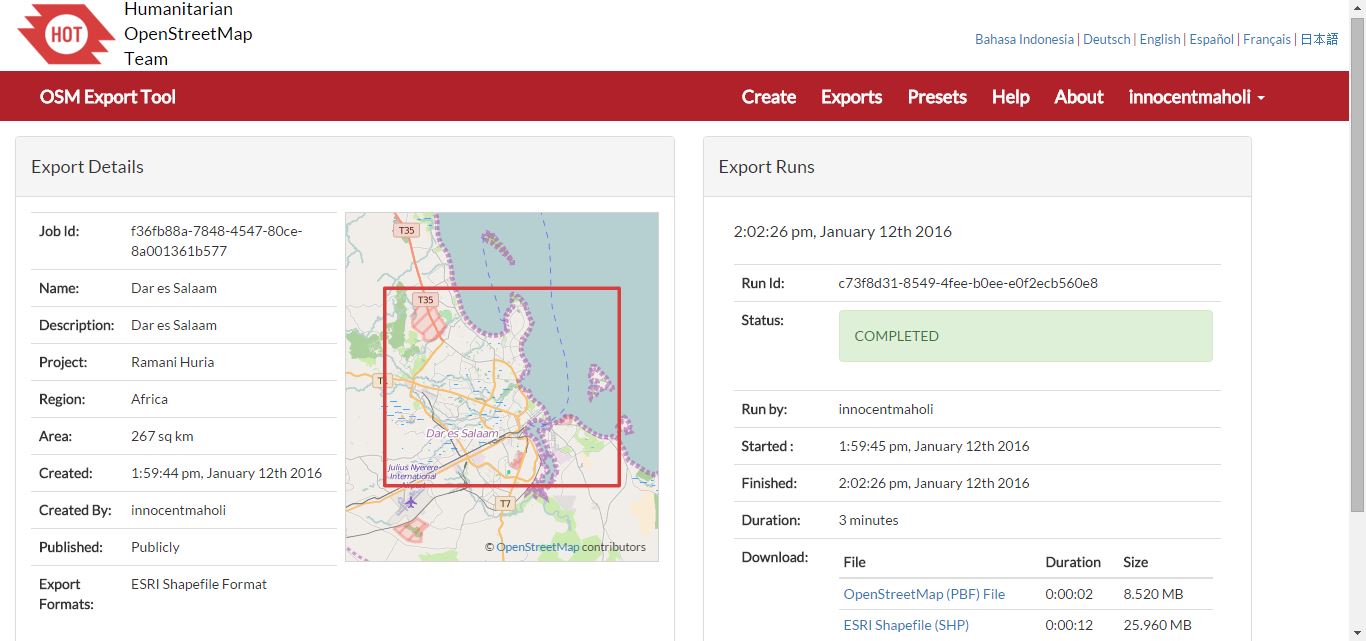
Creating your export – Export details & export runs
The next screen will show details of your export on the left hand side and status of the export on the right hand side. You may need to wait a moment for the status to read ‘completed’ before you can download your files. You will also receive an email from HOT Export Tool with a link to download the files.
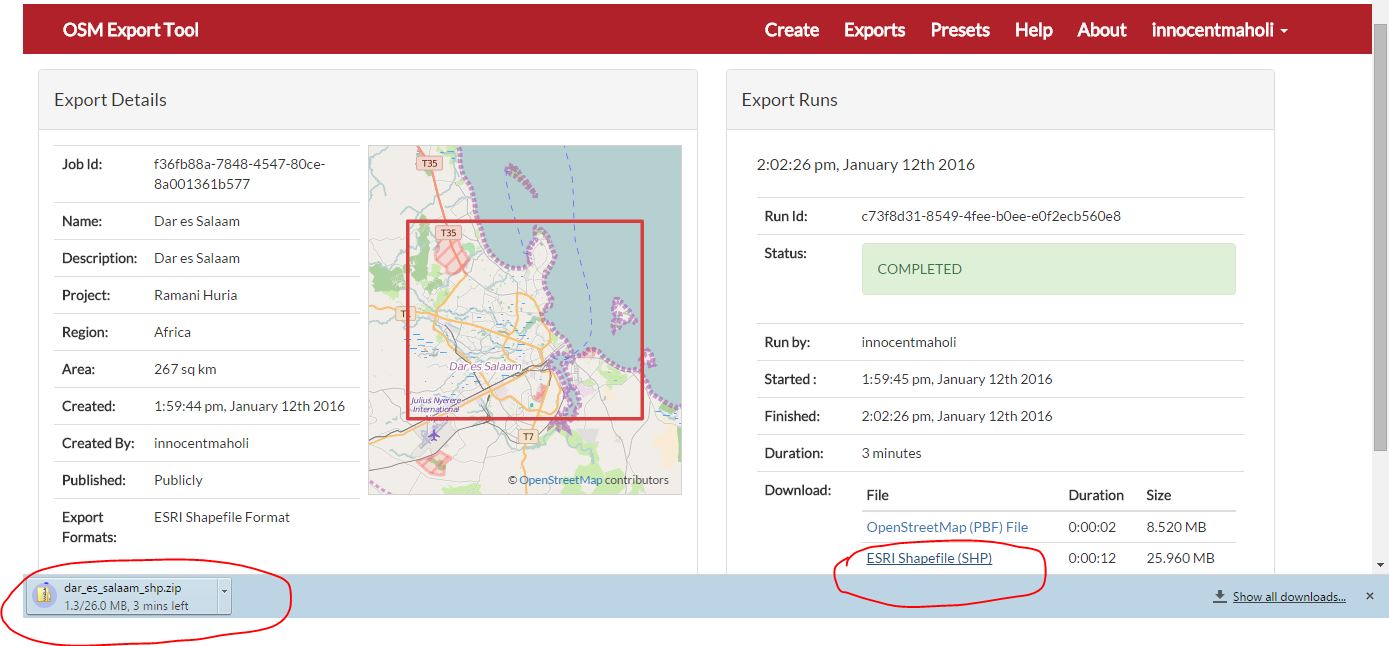
Downloading your exports
The export files (of the file types you requested) will be listed in the download box. Click on the file names to download directly onto your computer.
To use your exports, unzip the files and load your shapefiles to your mapping software, such as QGIS.
You can see any exports or presets other users have made publically available under the ‘Exports’ and ‘Presets’ menu options.
If you need additional assistance using the HOT Export Tool, take a look at the help section (found in the menu bar) or come along to a Maptime Tanzania events and one of the Ramani Huria team will be happy to help you!
*Guest post by Kathryn Davis, Columbia University*
January 14th, 10:30 am. We arrive in Chang’ombe ward (an industrial area in Dar es Salaam) after weaving in and out of traffic in the project bajaj (rickshaw) through different neighbourhoods. Johannes Peter, a seasoned mapper with the Dar Ramani Huria project, takes another look at his drone imagery printout of the area and indicates that we’ve arrived at our starting point. He starts the OSMTracker app on his phone, ready to start work (the tracker app helps him to geolocate, and take pictures of interesting areas, with the pictures tagged to a GPS location). Mappers like Johannes detail key drainage and water infrastructure that hasn’t been digitized before and that can be used for disaster risk reduction planning and flood resilience. He stops to check the map again, and then we’re off looking for drainage systems (our main task for the day). Carolina and I (two Columbia University graduate students, here on a preliminary trip to evaluate the project) are tagging along on a regular day for the Dar Ramani Huria project, to see the work team members are doing in the field. It’s not easy work, but essential to the project.
Almost immediately, we see drainage on the right side of the wide dirt road and mark it on the map. Johannes quickly identifies where we are on the map, and starts using the OSM Tracker App to identify the drainage, and to note indications of garbage or other debris blocking it. He uses his phone to photograph this: the Tracker App automatically geotags the image, to give a visual for other OSM map users. All the data that Johannes collects today will be “digitized” (added to the online map) later, so it’s crucial to get details right, and we spend time noting each part of the drainage system that we can see, including the direction of water flow, which might indicate a drainage convergence at that point, or where drainage ends abruptly with no continuation. Johannes is systematic in his mapping: we cross part of the outer perimeter of the ward, then move down inner roads, stopping each time to note important drainage details.
By now we’re halfway through and the midday sun is shining on us, but with a quick water break we’re off again, to finish the area we’ve been assigned for the day. We see drainage under construction: Johannes indicates that on the map too, as drainage on these roads is likely to change in the coming weeks. We also see that part of one of the roads is flooded after light rain the day before. Drainage can go underground, or we may need to figure out where the road is from the map: walking these roads and mapping takes a person who is comfortable asking questions, and Johannes, who’s from the city, is always ready to ask people in the neighbourhood he’s mapping for help, whether it’s for directions or the name of someone who might know where the non-visible drainage lines go.
After a day in the field, Johannes brings the now annotated maps to BUNI Innovation Hub to digitize. BUNI which is where the HOT team works from in Dar es Salaam when they are not in the field mapping. At this phase in the project, mappers typically work two days in the field, then one day digitizing their field data into the OSM platform. The 22 mappers currently on the project (most of whom have been there since the initial mapping in early 2015), have mapped many wards in the city of Dar es Salaam. The project was completed in detail infrastructure of 21 wards in Dar es Salaam and is now finishing a review of the drainage in these wards, and mapping 32 additional wards.
As we’re pulling away in the bajaj at the end of the day, we asked Johannes about using the data, mapping and being part of the project. He told us that “we are the Humanitarian OpenStreetMap Team. Humanitarian means that we are taking care of people, and this means that some things we have to do voluntarily”. Most of the main mappers (including Johannes) have recently obtained university degrees in urban planning or geography, and are extremely passionate about their work. When he visited the Katavi Region in the southern part of Tanzania to visit family, he saw there were no maps, so he started mapping the area using the skills from he learned from the project. For Johannes, mapping isn’t just what he does at work with the Dar Ramani Project. It’s also something he does in his free time.
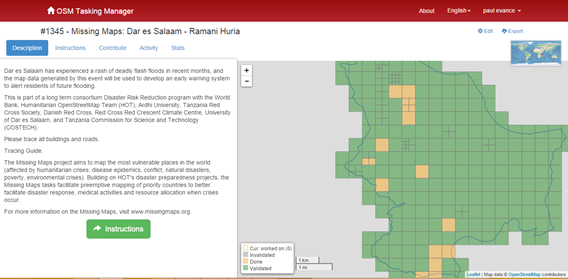
Throughout the world, many people contribute to the collaborative community of OpenStreetMap. For anyone who is interested in volunteering their time to map unmapped parts of the world, OSM Tasking Manager is a great way to find projects to assist on. OSM Tasking Manager (https://tasks.hotosm.org) is a mapping tool designed and built to coordinate mapping by Humanitarian OSM Team volunteers, making it easier for mappers to work together and avoiding conflicts in areas in the process of being mapped. The purpose of the tool is to divide up a mapping job into smaller tasks that can be completed rapidly. It shows which areas need to be mapped and which areas need the mapping validated. An area to be mapped is broken down into smaller areas on a grid so that mapping can be done in an organised way and distributed among volunteers throughout the world. As a result, mapping can also be completed quickly, which is especially vital in the context of an emergency.
The Ramani Huria project has made use of the OSM Tasking Manager throughout our work, especially in when remote mapping to minimize the risk of overlapping work areas. We have used the tool during Maptime events and mapping parties where we have mapped several wards of Dar es Salaam, including the subwards of: Makuburi; Kimanga; Kigamboni; Tungi; Vijibweni; Mjimwema; and Kibada. During OSM Geoweek 2015 events we facilitated at the University of Dar es Salaam and Ardhi University, we made use of OSM Tasking Manager to facilitate a mapathon including 150 volunteer mappers (see: https://tasks.hotosm.org/project/1345).
To start using OSM Tasking Manager, you will need an OpenStreetMap user account. To log in, click ‘login to OpenStreetMap’ in the top right corner of the page. If you don’t have an account, you will see a link to register or go directly to: https://www.openstreetmap.org/user/new
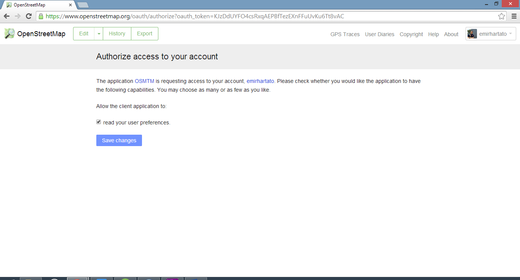
Authorising your OpenStreetMap account with OSM Tasking Manager
Once you have logged you will be asked to authorise access to your account. Click ‘Save changes’ to allow OSM Tasking Manager to allow access and remember your account in the future.
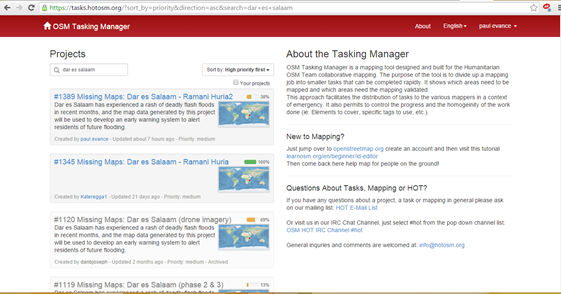
Once you have logged in you will see a list of projects on the left hand side of the page, usually, the highest priority will be listed first. You can also search for specific tasks, including looking for mapping tasks by the city of the country. For example, search ‘Dar es Salaam’ and you will see all tasks for the city of Dar es Salaam.
Once you have found the project you want to work on, click on the title of the task and you will open a page with details on that task.
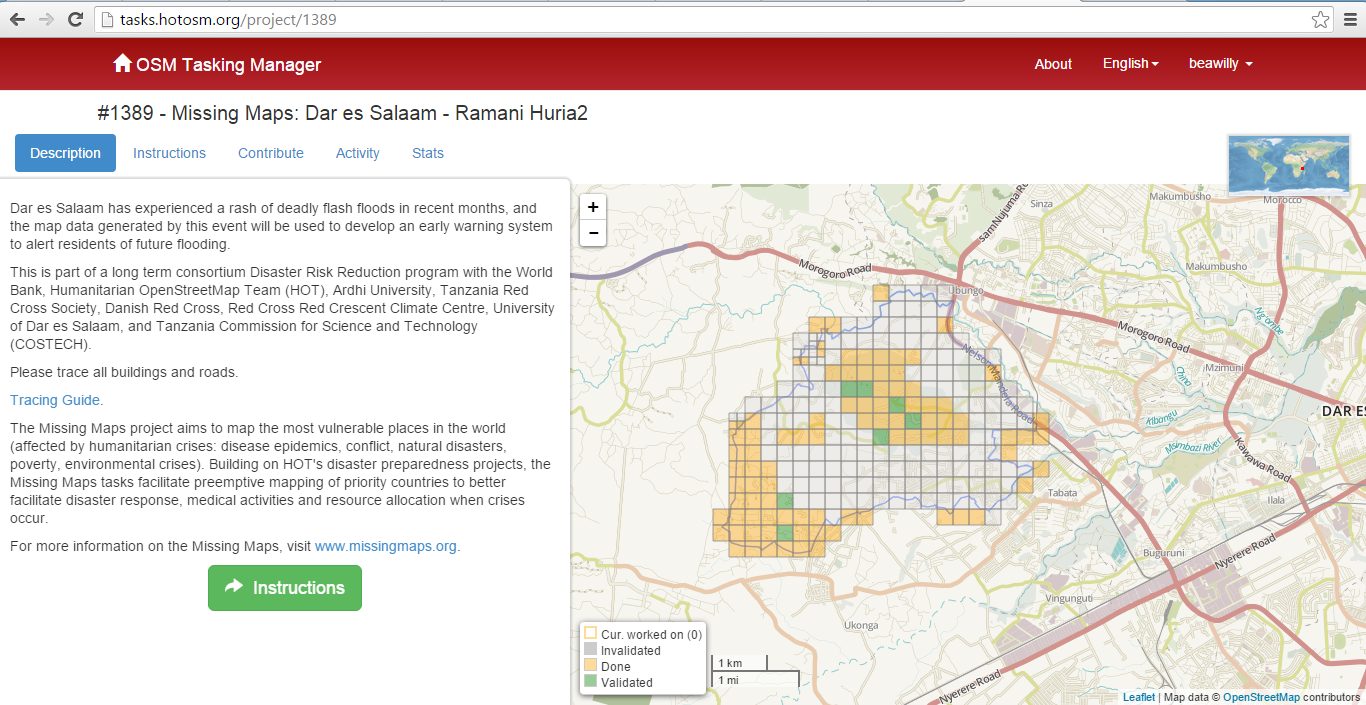
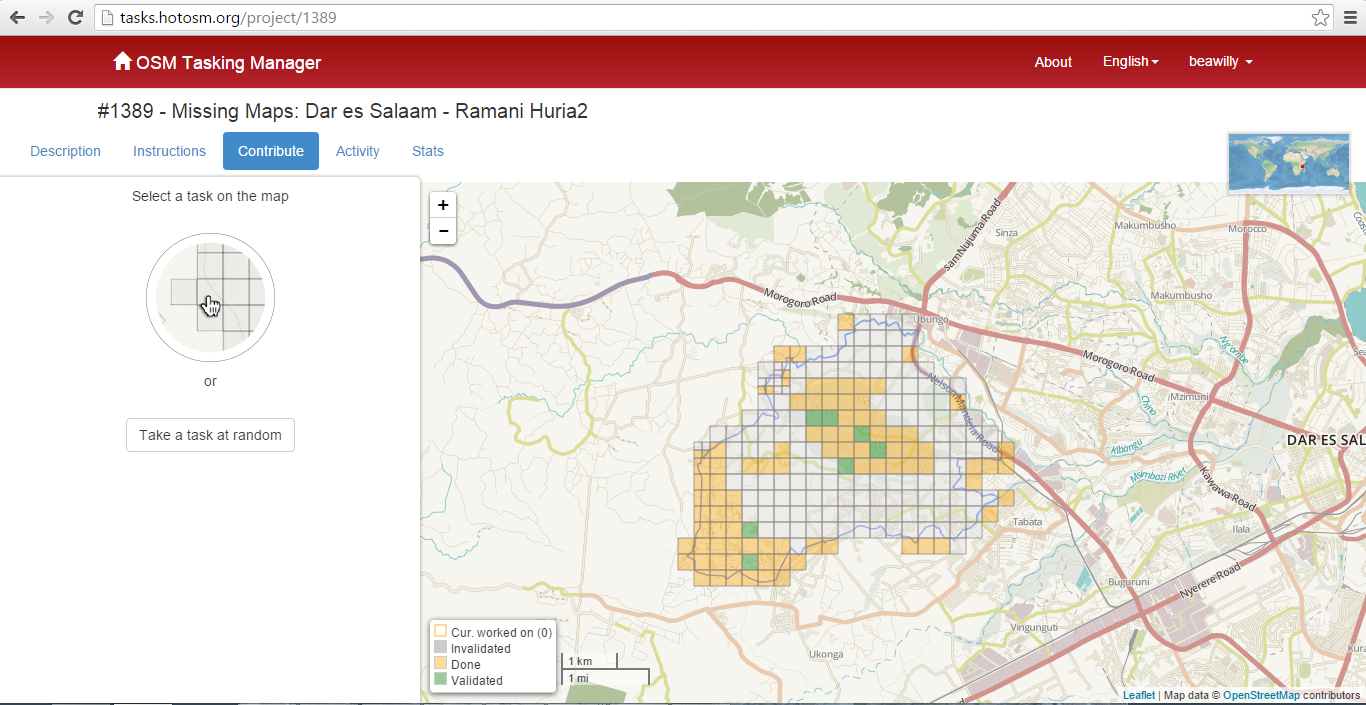
Each project will have five tabs on the left hand side of the page, and an image of the area to be mapped on the right hand side of the page. The tabs will give you all the information you need to start mapping, including:
Description – read the description carefully, this gives you an overview of the task and the goals of the mapping
Instructions – this tells you what needs to be mapped (‘Entities to Map’) and the comments to put when uploading data to the OSM database (‘Changeset Comment’), often this will include hashtags to track mapping activities. It also will give a link to a dedicated preset if you are mapping in JOSM.
Contribute – this section is where you will start your mapping by either selecting a task on the map or taking a task at random
Activity – this lists all the activity been done in this task by chronological order including who has contributed (with OSM username), the areas they have mapped, and date stamp.
Stats – here you will find stats on how much of the task has been done and validated, as well as information on contributors, including their OSM username and number of sections done.
To begin mapping, select the ‘Contribute’ tab. Other mappers may have already begin to work on the map and you can see what areas need mapping or are in the process of being mapped by the colour of the square:
Squares with a yellow outline are currently being worked on – you cannot work on these areas until the person currently mapping unlocks that area
Grey squares are invalidated and haven’t yet been mapped
Yellow squares are done but not yet validated
Green squares are validated i.e. they have been completed
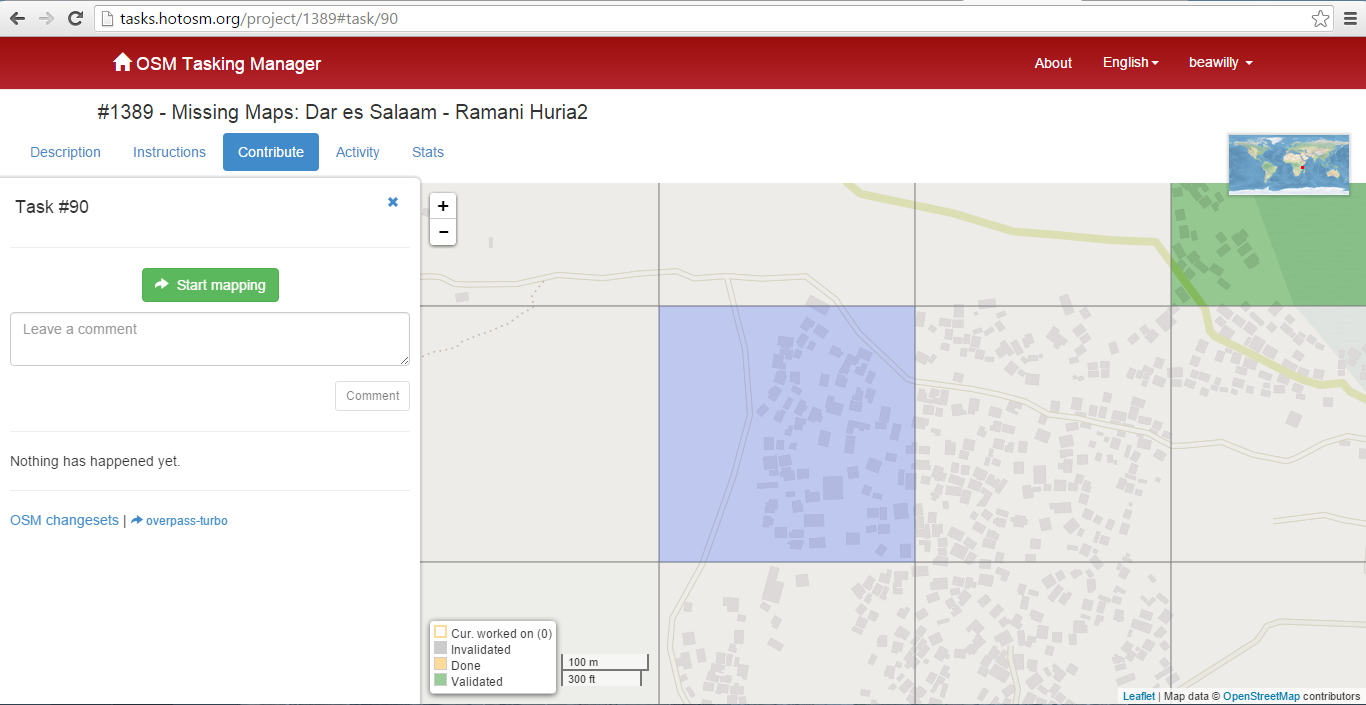
Selected an unmapped grey square to begin mapping a specific task on the map or click on the button to ‘Take a task at random’.
When you select a square, details of the mapping in that area will be in the left hand side of the screen, as well as the specific task number. Click start mapping to begin.
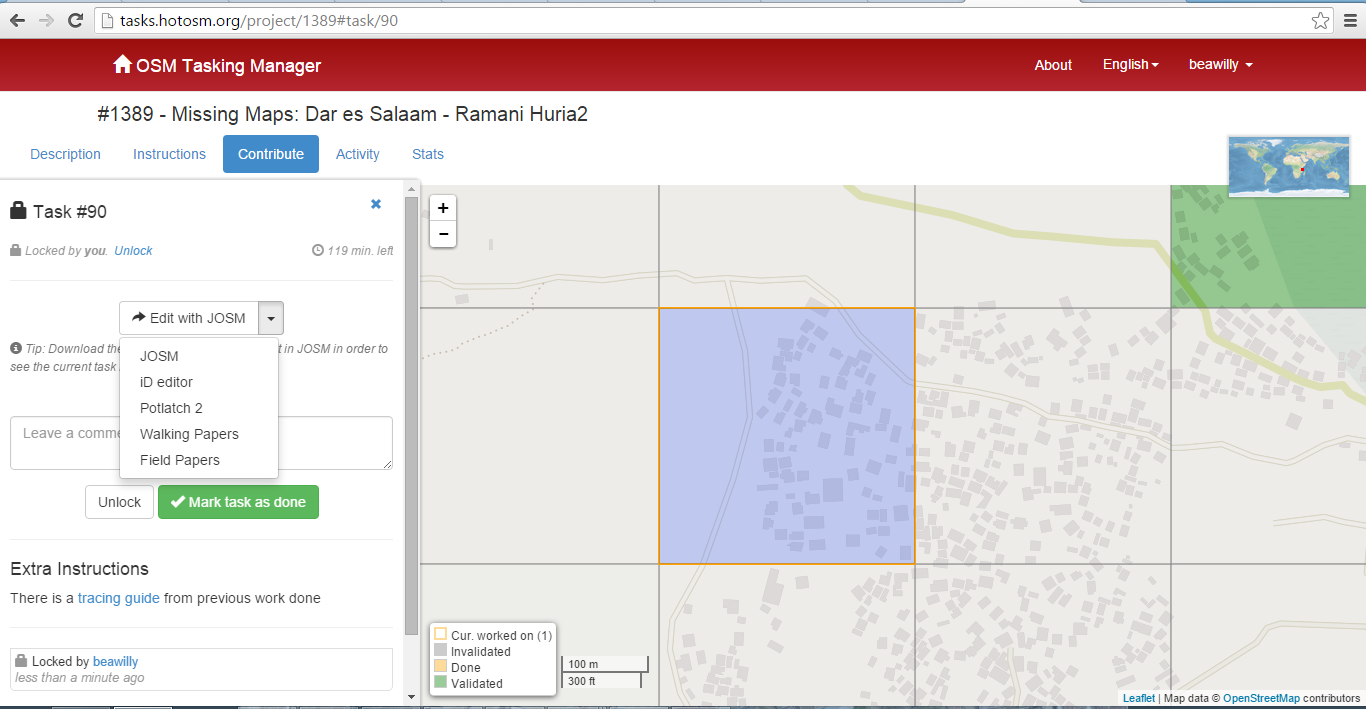
Editing the map
Selecting your prefered editing tool to start mapping
When you start mapping an area, it will be locked for two hours, meaning no one else can work on this subtask while you are mapping. After this time, it will be automatically released so it’s important to make sure you know when this happens to avoid conflicts with other mappers on the same task.
If the area is too big or complex for you to map within two hours, it’s a good idea to split the task into several smaller squares.
Finishing mapping and/or unlocking the task
If you have to stop mapping, or don’t have time to complete the area you are mapping within the time, it’s good practise to leave a comment about your progress and what remains to be mapped. You can add in as much information as is relevant, and then click ‘unlock’.
If you have completed the task and mapped the entire area as requested, make sure you make the task as ‘complete’ so other mappers don’t have to come back and check through the area. Always leave any comments you think are relevant, including areas of the map you are unsure of. You can also tag in other OSM users by using the @ sign before their username, this is especially useful if you are working with other mappers or have a supervisor assisting you.
Come along to a Maptime event supported by Ramani Huria and put your new skills to practise. The community can also help you answer any questions you have about the tool. You can find details of the next Maptime event on our social media pages: Facebook and Twitter.