JOSM (Java OpenStreetMap Editor) is a desktop application to conduct mapping activities, the data from which can be added to OpenStreetMap (OSM). It is an open-source editor, written in Java. While initially, the interface may seem daunting compared to some other editors, JOSM offers many features which are extremely useful and isn’t too difficult to master. Another major benefit of JOSM is that mapping can be done offline, unlike with other editors such as iD or Potlatch. This has been very useful when mapping Dar es Salaam as our mappers do not always have a data connection.
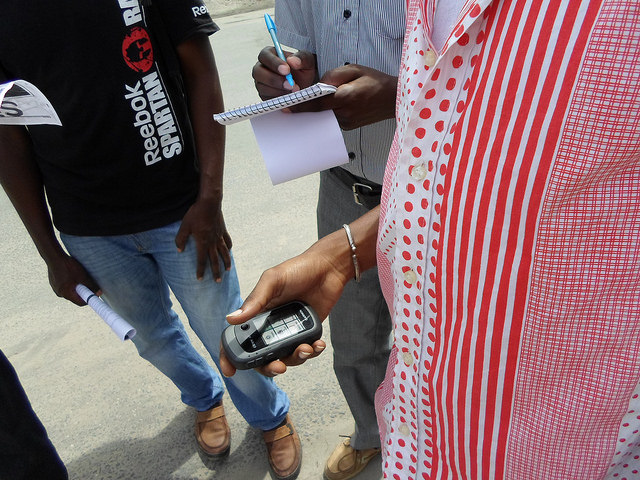
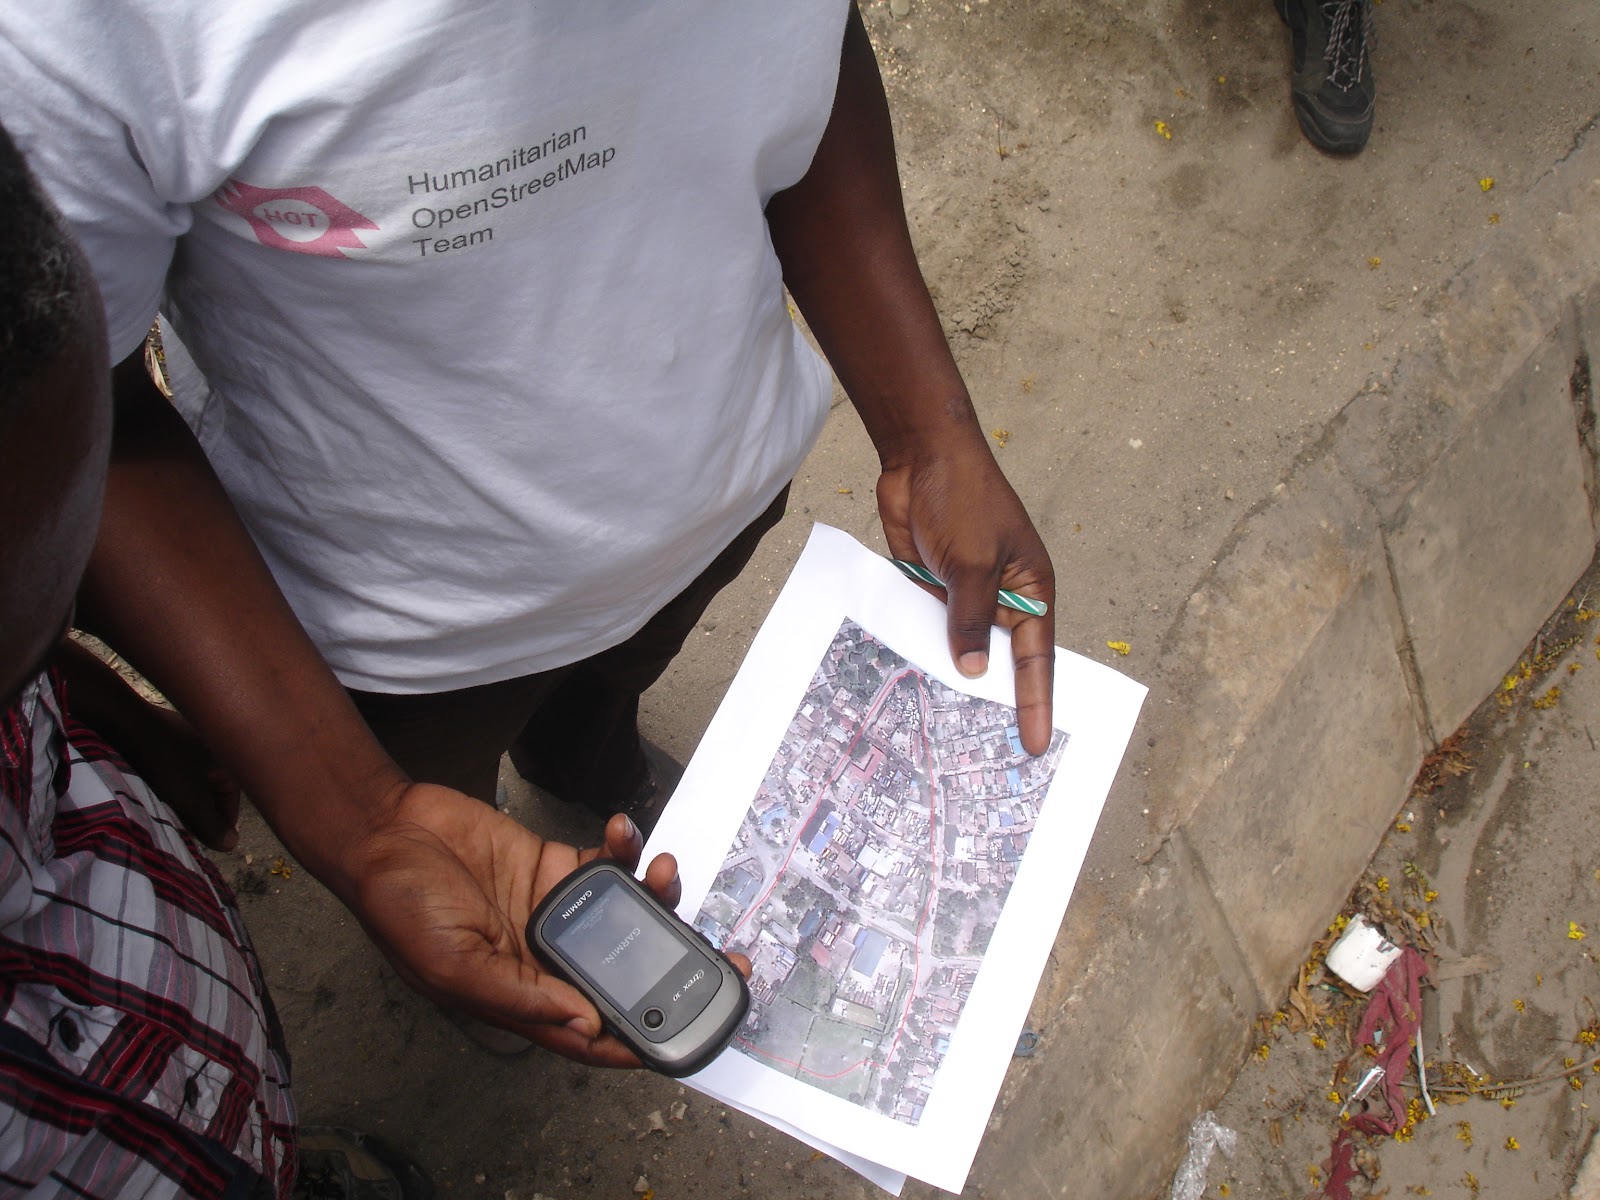
Ramani Huria has provided trainings to our student mappers, including training 200 students from the University of Dar es Salaam & Ardhi University. You can view this training material here.
Installing JOSM
How to install JOSM:
- Download the software relevant to your operating system (JOSM is available for Windows and Mac OS)
- Once downloaded, install and then launch the program. Once loaded you will see the following screen:

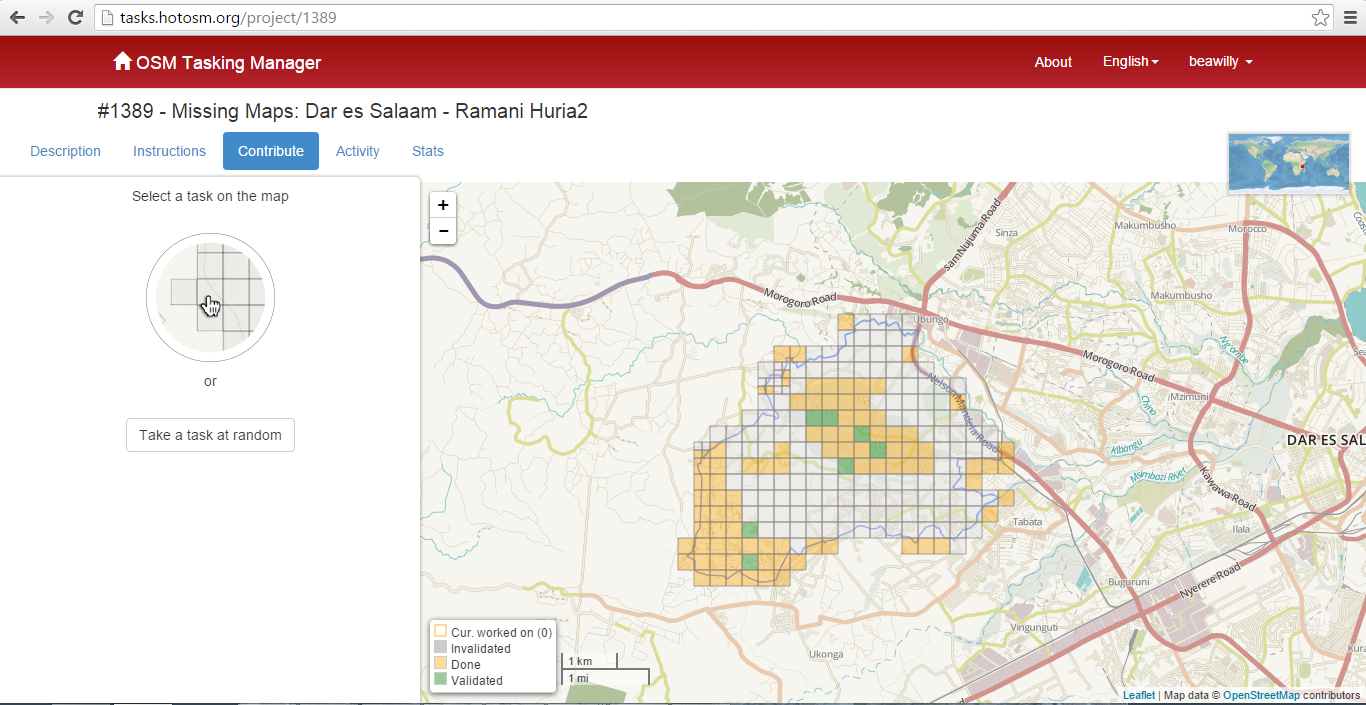
Downloading data

Once JOSM has been launched you will need to download data from the OSM servers to edit. From the main menu at the top of the screen, select File then Download from OSM.

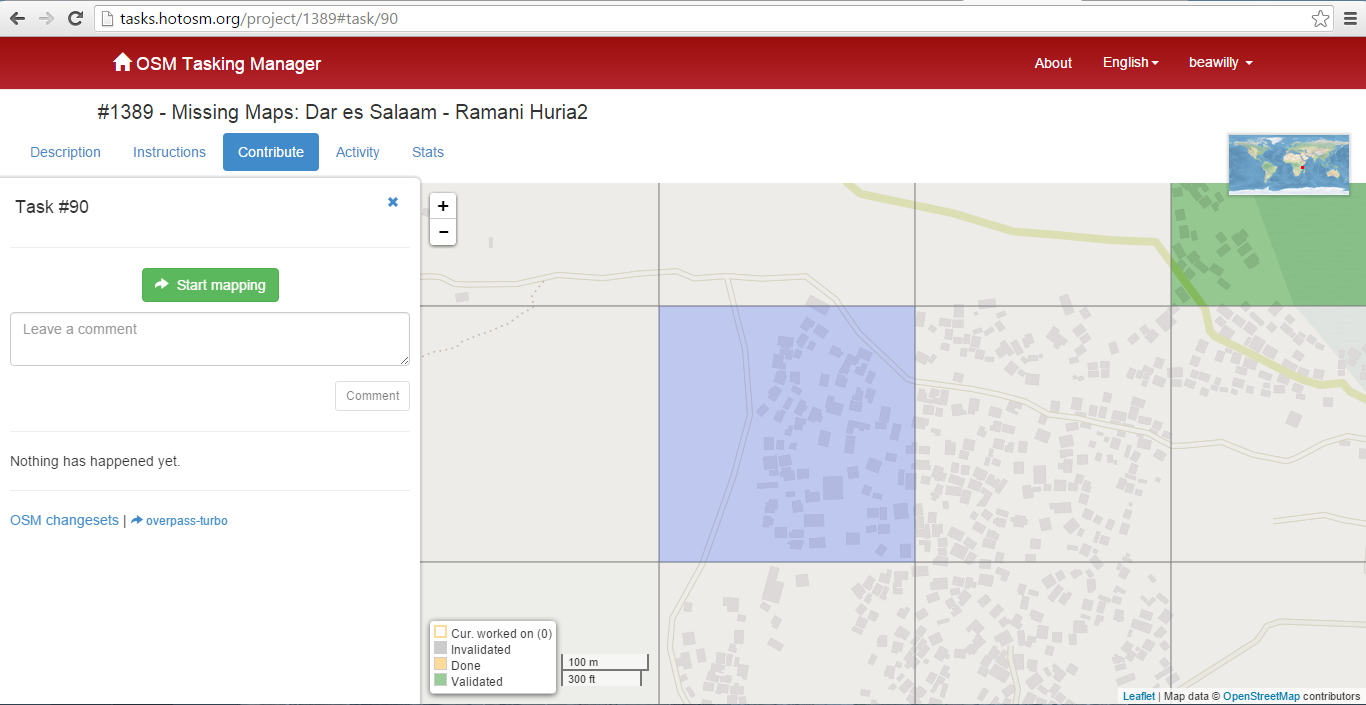
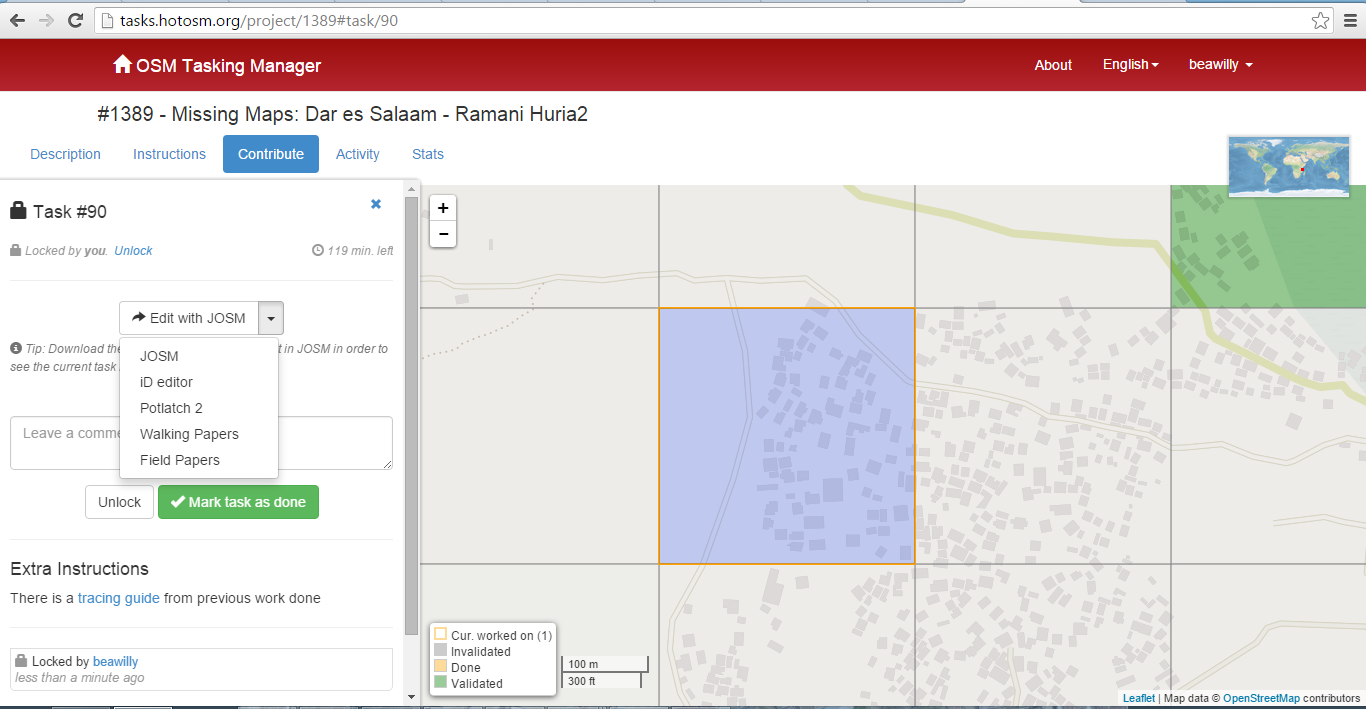
After clicking ‘Download from OSM’ a popup dialogue box with then open allowing you to select the specific you would like to download data for. Drag your mouse to select the area you would like, it will be highlighted as a pink box. Once you are happy with the area selected, click the ‘Download’ button at the bottom of the box. Data can also be downloaded from the OSM servers with a URL link. To import this way, select ‘File’, then ‘Open location’ and paste the link.
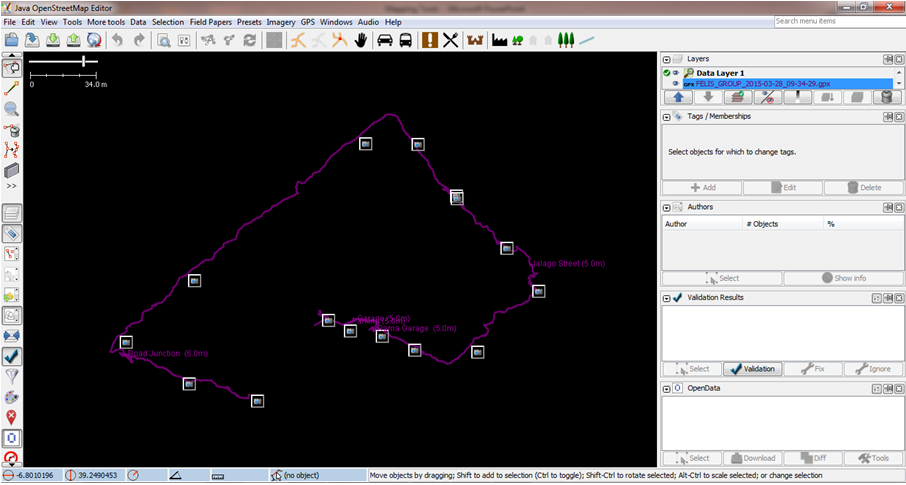
JOSM with then connect with the OSM servers to download the data layer. When data is downloaded, it will be visible in the central panel of JOSM, the ‘map view’ area (see below). Downloading large amounts of data may take a long time, depending on your internet connection, we recommend working with smaller portions and then when complete downloading another portion.
The JOSM Interface

Once you have downloaded the data, the full JOSM interface will open up. The following are key elements of the JOSM interface that you should be familiar with:
- Map View: the main window where geo-data is displayed and editing is done;
- Main menu: the menu from which most functions can be selected, the menu is also customizable depending on the plugins installed;
- Shortcut toolbar: a toolbar consisting of shortcuts to commands from the main menu. Highly customizable, menu items can be added or removed from the preference dialog;
- Edit tools: contains drawing tools and the show/hide buttons for the Toggle Dialogs window;
- Information panels: shows information about data in JOSM including a list of special features, objects, the way in which selected objects are tagged, the last mapper to edit a feature, and different layers in the current view.
Editing data

Once the data has downloaded, select ‘Imagery’ from the main menu and choose the imagery you would like to use, for example, Bing aerial imagery. If available for the area, we recommend mbtiles imagery as it is clearer than Bing aerial imagery.
The data layer will then be overlaid with the aerial imagery. The cross-hatched area shows you the area which is outside of the data you have downloaded from the server.

Layers can be controlled in the layers section of the information panel, including: activating or deactivating the visibility of a layer; changing the layer’s transparency; merging layers; duplicating a layer; deleting a layer.
Navigation in JOSM
While there may be some variations based on your operating system or computer, key navigation in JOSM include:
- right mouse button: used to drag the map and navigate in different directions
- left mouse button: used to manipulate an element
- scroll wheel: used to zoom in and out
Editing tools
The editing tools are found in the top left of of the shortcut bar (on the left of the screen) and here are three main modes of editing: select; draw nodes; delete nodes or ways.
| Use the draw nodes (shortcut A) to add new points, lines or polygons, or extend an existing way. | |
| Use select (shortcut S) to select elements, view/edit their tags, and move elements. | |
| Use delete notes (shortcut Ctrl+Delete) or ways to delete selected elements. |
Drawing basic elements

In drawing basic elements in JOSM, there are three main types of features that can be created, all of which are created by the draw nodes tool. The three classifications are:
- Node: this is a single point which marks a specific location, for example, a shop or mobile money agent location;
- Way: an ordered list of nodes connected by line segments, for example, roads, paths;
- Closed way: nodes which create a closed-loop to describe areas, for example, buildings, lakes, islands.
When drawing elements, it is also always advised to give the element the appropriate tag (explained further below).
To draw a standalone node:
- Clear your current selection, this can be done by the shortcut key ‘Esc/Escape’
- Select ‘Draw Nodes’ (shortcut A)
- Double click in the map view the location the node should be located
- Return to ‘Select’ and select ‘Presets’ then ‘Tags’ to tag the element, for example, if it is a kiosk, select Presets > Shops > Food > Kiosk. Additionally, tags can be searched by selecting Presets > Search Presets, or using the shortcut F3.
To draw away:
- A way consists of several nodes, once you have selected one node, click again in the map view to create a second node
- Continue to click in the map view to create a number of nodes which will form a line
- To finish, double click on the last node of the way or press ‘Esc/Escape’
- Tag the feature in the same way as for a node, for example for a residential road select Presets > Highways > Streets > Residential
To draw a closed way:
- Click on the map view where the polygon will begin
- continue to click to create the shape of the polygon – note that a closed way should be a closed area
- to finish, click on the first node of the way – this will close the area being drawn
- Tag the feature, as above, for example for a residential building select Presets > Man-made > building. For this type of tag, an additional pop-up window will open to add additional information on the building, including the type of building, name of the building, and height of the building.
Tagging

Tags describe data in OSM and are attributes that label basic elements (nodes, ways, closed ways). A tag is composed of a key and value. A key is a label that gives the general classification of the feature, the value gives more specific information. Both the key and value are always in lowercase and do not include spaces if space would normally be used and underscore is used instead.
Tags are displayed on the right-hand side of the screen under ‘properties/memberships’. When you select an element, a table will appear in this area showing both key and value fields.
Features may have multiple tags. It is advisable to add all relevant tags to any element you create as this will improve the quality of the data you upload and assist other mappers.
Presets

Presets are tags that are ‘human-readable’ and allow elements to be labelled from a predefined menu. To do so, select presets from the main menu and choose the preset labels that match your element.
Uploading data to OSM servers
Once you have created/edited/deleted and tagged all features in your downloaded data, the amended data can be uploaded to the OSM servers.

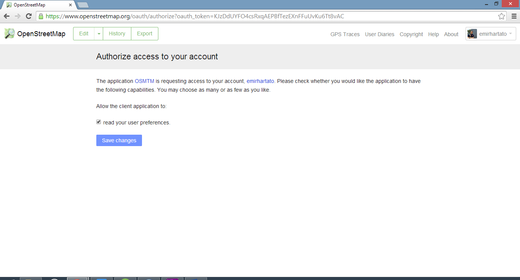
Log in with OSM username & password
Log in to JOSM by selecting Edit > Preferences > Connection from the main menu. Input your osm_id (OSM username) and password, then click OK.

Uploading data to OSM
Once logged in, select File > Upload data (shortcut Ctrl+shift+up) from the main menu. A pop-up menu will list the data to be uploaded and ask you to provide comments on the changes, for example, ‘Community mapping for flood resilience – Sinza’, and specify the source for changes, for example, Bing aerial imagery. It is always wise to add specific information about the changes you have made to assist other mappers and improve the quality of the data.
To upload, click ‘Upload changes’ and your data will be uploaded to the OSM servers. When the upload is complete, you will be notified with the message ‘Upload Successful’ – don’t close JOSM until you have received this confirmation.
Congratulations, you have now contributed to OpenStreetMap by using JOSM!
Learn more
JOSM is a very powerful tool and used by experienced mappers as well as beginners. To learn more about the many features and tools available through JOSM see the JOSM section of ‘Learn OSM’.
If you have questions about using JOSM the Ramani Huria team is always happy to help. We support monthly Maptime Tanzania events where we often provide additional training on JOSM. Get in touch with us or come along to our next Maptime Tanzania event to learn more or get specific help.