Localisation is currently underway to formalise the informal urban settlements of Dar es Salaam which currently comprise 70% of the city. Formalising a settlement is incremental in giving legitimacy to a community and in increasing the security of tenure of the residents and their land rights. Formalising settlements also allows for more detailed, sustainable city planning. Unfortunately, the current methods of data collection to understand these boundaries has resulted in inaccurate data and partial community engagement.
To help improve current data collection methods needed for localisation, the HOT Tanzania team recently provided three days of training with 6 Masters students, all studying a Master of Science in Urban Planning and Management (Msc. UPM), and 3 members of staff at Ardhi University. Up until now, the method taken to map informal settlements has involved the use of drone and satellite imagery to identify resident boundaries. This process tends to be inaccurate and time consuming since local people are accustomed to the day to day 3D visualisation of their homes at street level, not a 2D drone image taken from above. The densely populated areas also make it almost impossible to identify individual houses and define boundaries.
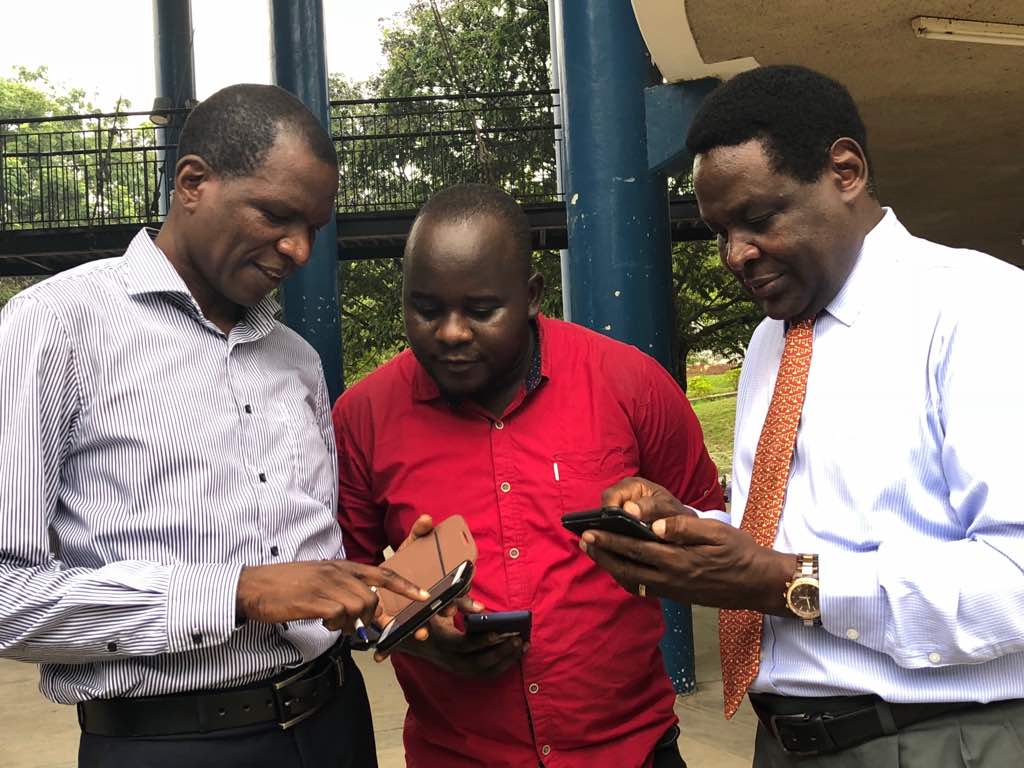
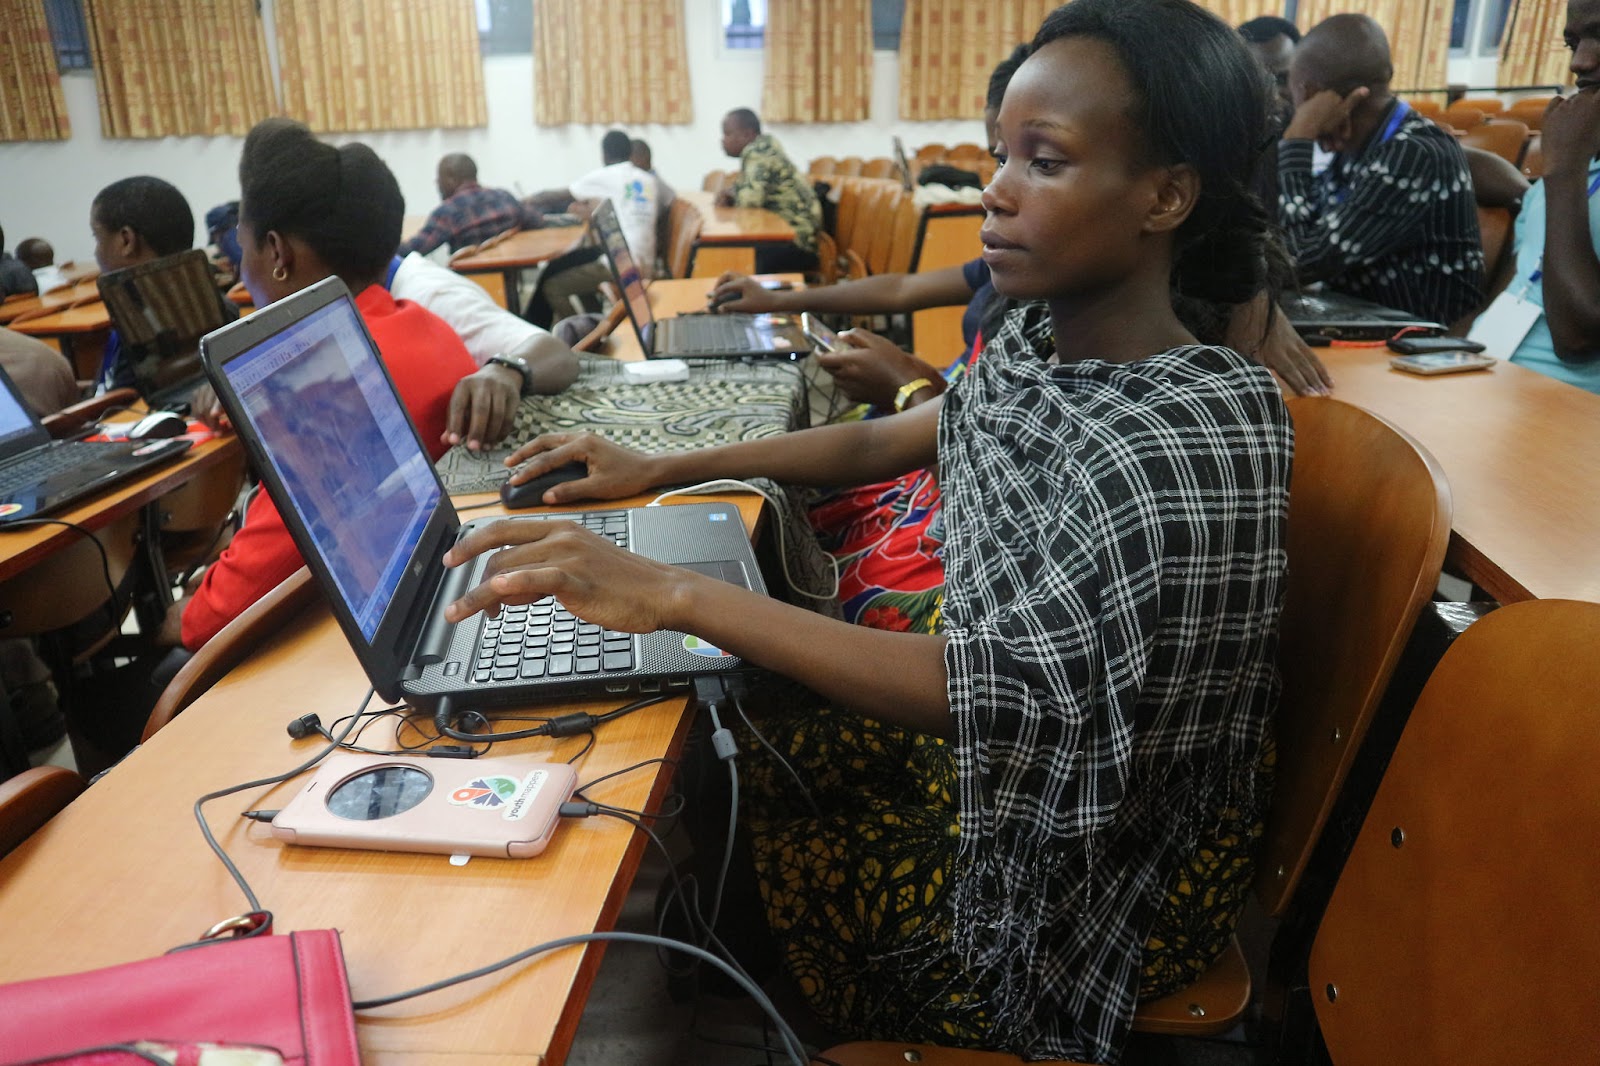
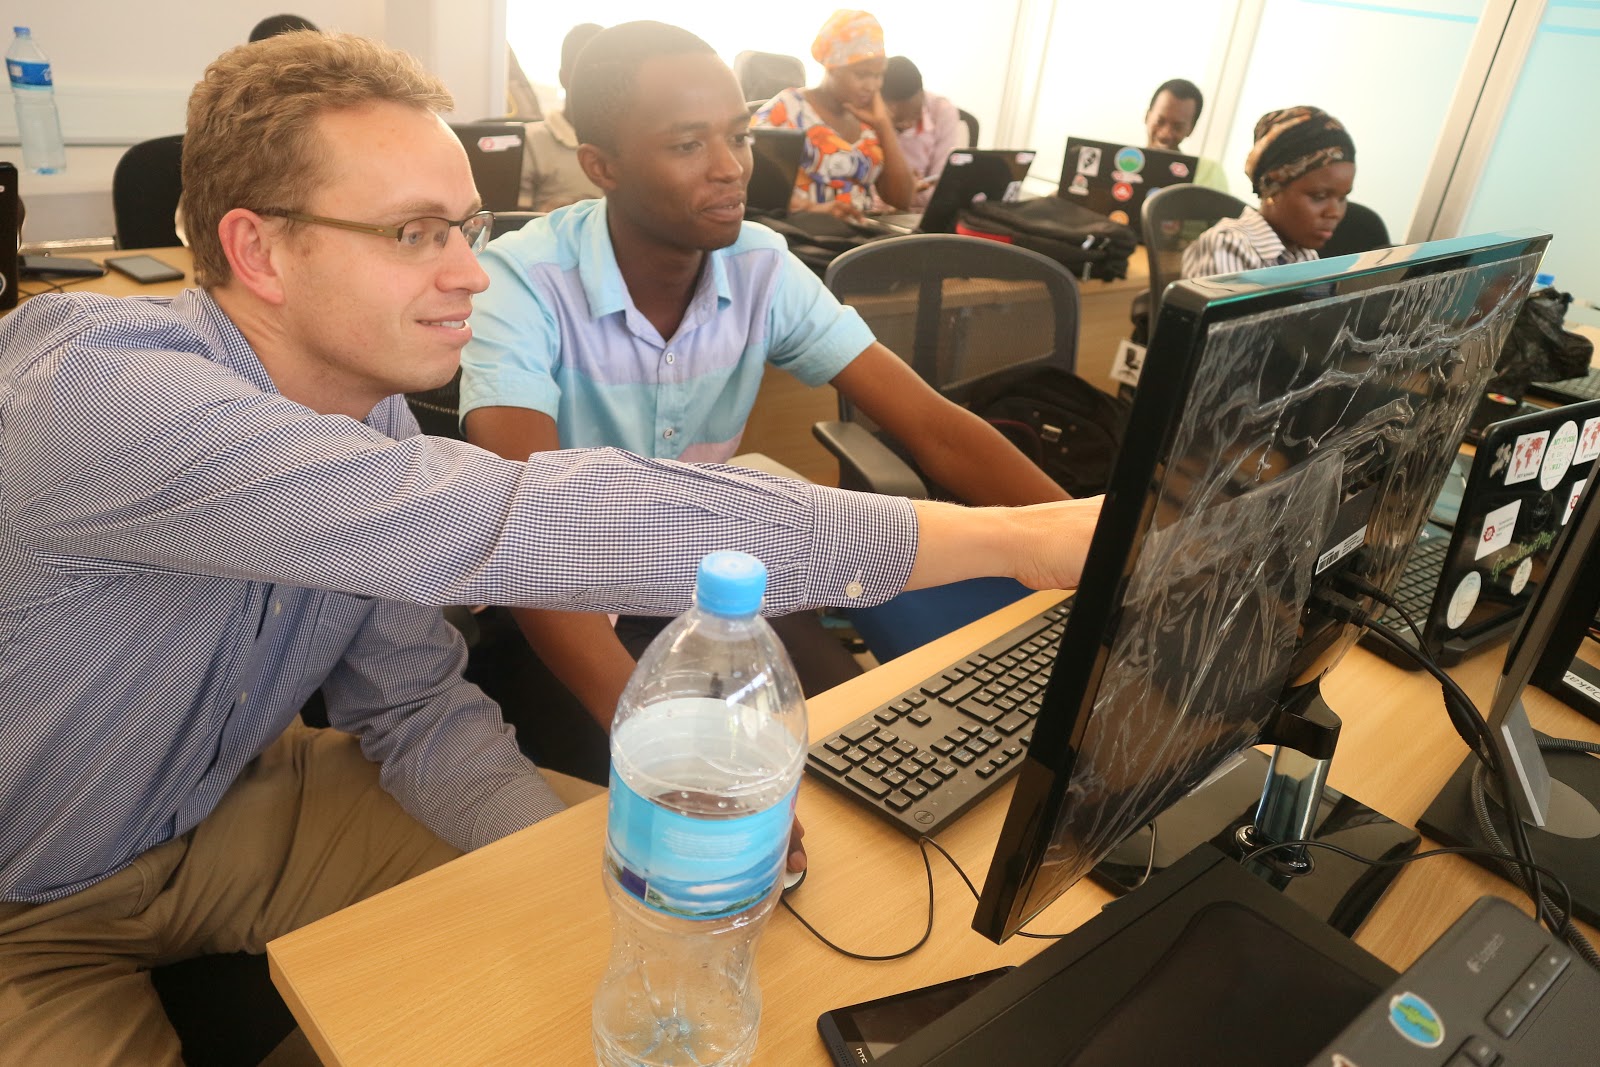
Prof Tumsifu Jonas Nkya(right), Dr John Lukenangula at Ardhi University (left) installing and practising using Open Data Kit (ODK) during training from Ramani Huria expert Iddy Chazua (middle)
Hoping to increase community participation and data accuracy, the HOT team have been teaching students and staff about open community mapping. The training involved workshops on using OpenStreetMap (OSM), JOSM, OpenDataKit (ODK), and OpenMapKit (OMK). Using these tools, digital surveys can collect data at street level by speaking with inhabitants to identify land-use, ownership and usage of buildings, and socio-economic status of inhabitants. Tagging building attribute on OpenMapKit whilst conducting the surveys at ground level ensures that land-use can be defined more accurately. This data can then be used to map out residency boundaries. This method is quicker and more environmentally friendly than previous paper surveys since the additional data inputting stage is removed from the process. By involving community members directly in the mapping process in a format that they can relate to, more accurate data is collected. When community mapping begins, local Shina (division of a sub-ward) leaders, Wajumbe, will accompany the field data collection team to speak with local inhabitants to reassure them.
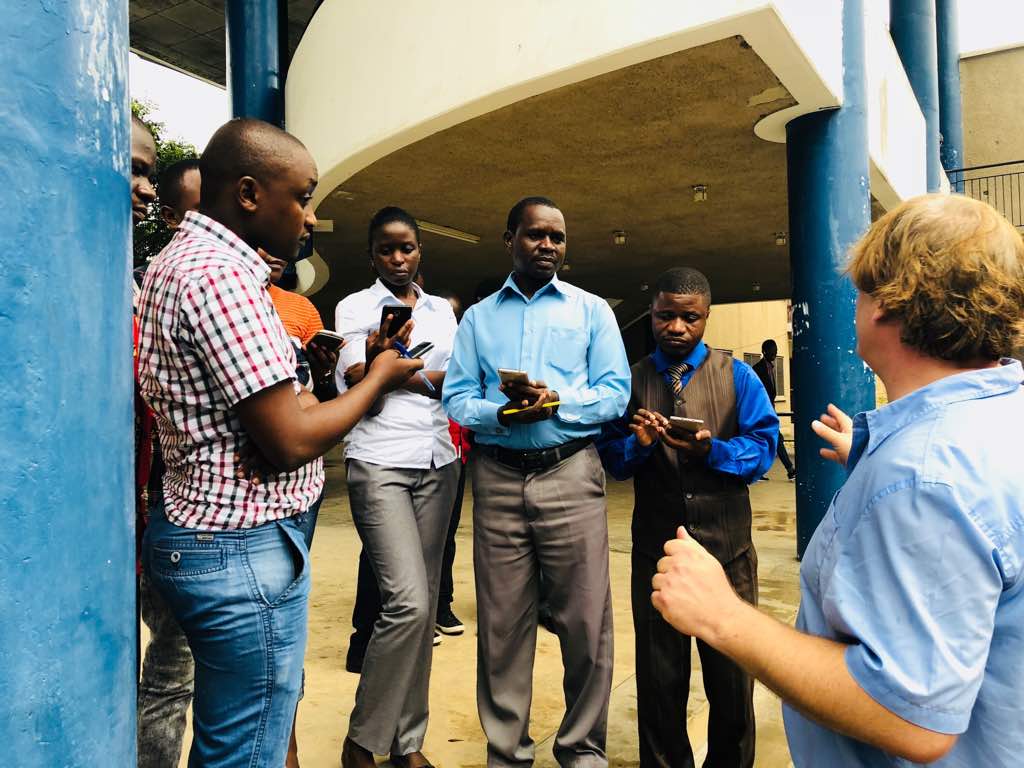
Training by practice led by Ivan Gayton, HOT Tanzania Country Manager.
The maps created from this project will be accessible to everyone online through OpenStreetMap. This means that for the first time, inhabitants of informal settlement will exist on a map and can be more included and involved in future plans for their city. Printed maps will be used as Town Planning drawing which will study existing city conditions and land-use and consider where resources should be allocated or which areas are in need of development. The maps will also help monitor changes in building usage since, currently, government officials don’t have a referral point for building use if someone requests permission to change building function.
“Community Mapping can facilitate community participation by inhabitants mapping their properties and involving them in any other data collection which is crucial for the regularization activity” – Luteranya Mapambano Msc student in UPM 2017/18
“Community Mapping is a key instrument in shortening time at site during regularization, since any person can find necessary information like development and any other main features without the necessity of going to the site” – Jikora, Emmanuel, UPM Student
Currently 70% of the infrastructure in Dar es Salaam is unplanned, meaning that structures are often built in flood areas and are not adequately built to cope with high waters. Often, even unplanned buildings that are relatively ‘safe’ from flooding have huge consequences on the surrounding area; improper planning has led to an increase of compact soil, which has low absorption rates to help disperse water during floods.
Ramani Huria is a project lead by HOT, with the aim to produce maps with the main intention of improving flood resilience planning and raising awareness of safe areas for local people. This means that future houses can be built in safe zones and that steps can be taken to reinforce or relocate buildings that are currently at risk. Moreover, it can mitigate the risk of cholera and prevent sudden displacement.
Amelia Hunt – Mapping Trainer and Project Assistant, HOT – and Zac Hill – Consultant, This is All – arrived in Dar es Salaam and have spent the last two days in the HOT office in dLab. In this blog post they outline what they have learnt about the Ramani Huria project by speaking to team members.
This blog post has been broken down into three sections: Technology, People, and Communities.
Technology
In the western world we are often faced with the perception of the developing world that has been presented by the media and development sector over the last 60 odd years – the image of poor people whose only livelihood is a small farm, travelling however many miles a day to collect water. Whilst it would be inaccurate to claim that access to better agriculture and clean water isn’t still an issue in continents like Africa, we can claim that the image is not representative of all of Africa.
Many countries in Africa are very well connected, and Tanzania isn’t an exception. This connectivity allows ample opportunities, including the digital mapping activities performed by volunteers and staff at HOT. Moreover, all the team members we have met so far are Tanzanians, demonstrating that the traditional approach of using Western surveyors is an unnecessary expense. Armed with local knowledge, Tanzanian volunteers are able to cover more ground in less time and are able to collect more accurate data due to local language and cultural understanding.
Ramani Huria 2.0 has seen an improvement to data quality and a more structured approach to team management. Field supervisors are committed to leading their teams by example so that they can demonstrate good data collection processes, inspire participants to enjoy their work, and help them see the importance of collecting reliable, accurate data. The technology and training provided to volunteers, teamed with their commitment and passion for mapping, makes them one of the most efficient and talented digitisation teams.
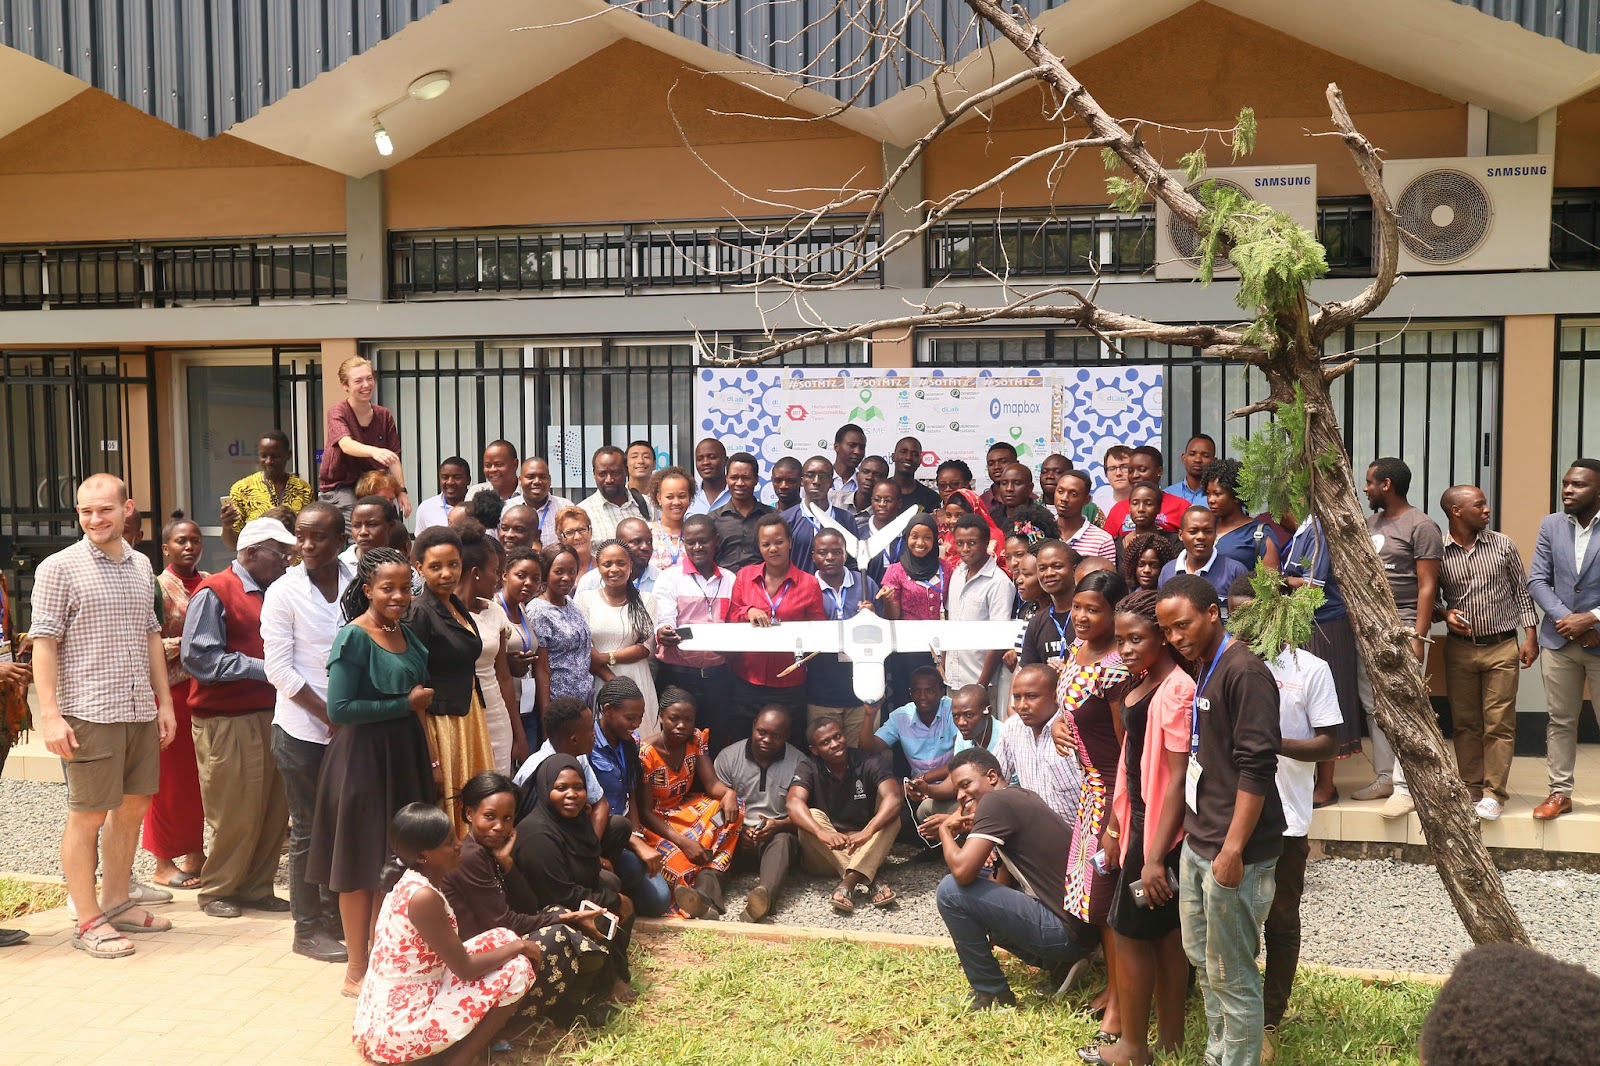
State of the Map Conference Tanzania 2017 hosted by Ramani Huria and partners which had over 170 participants
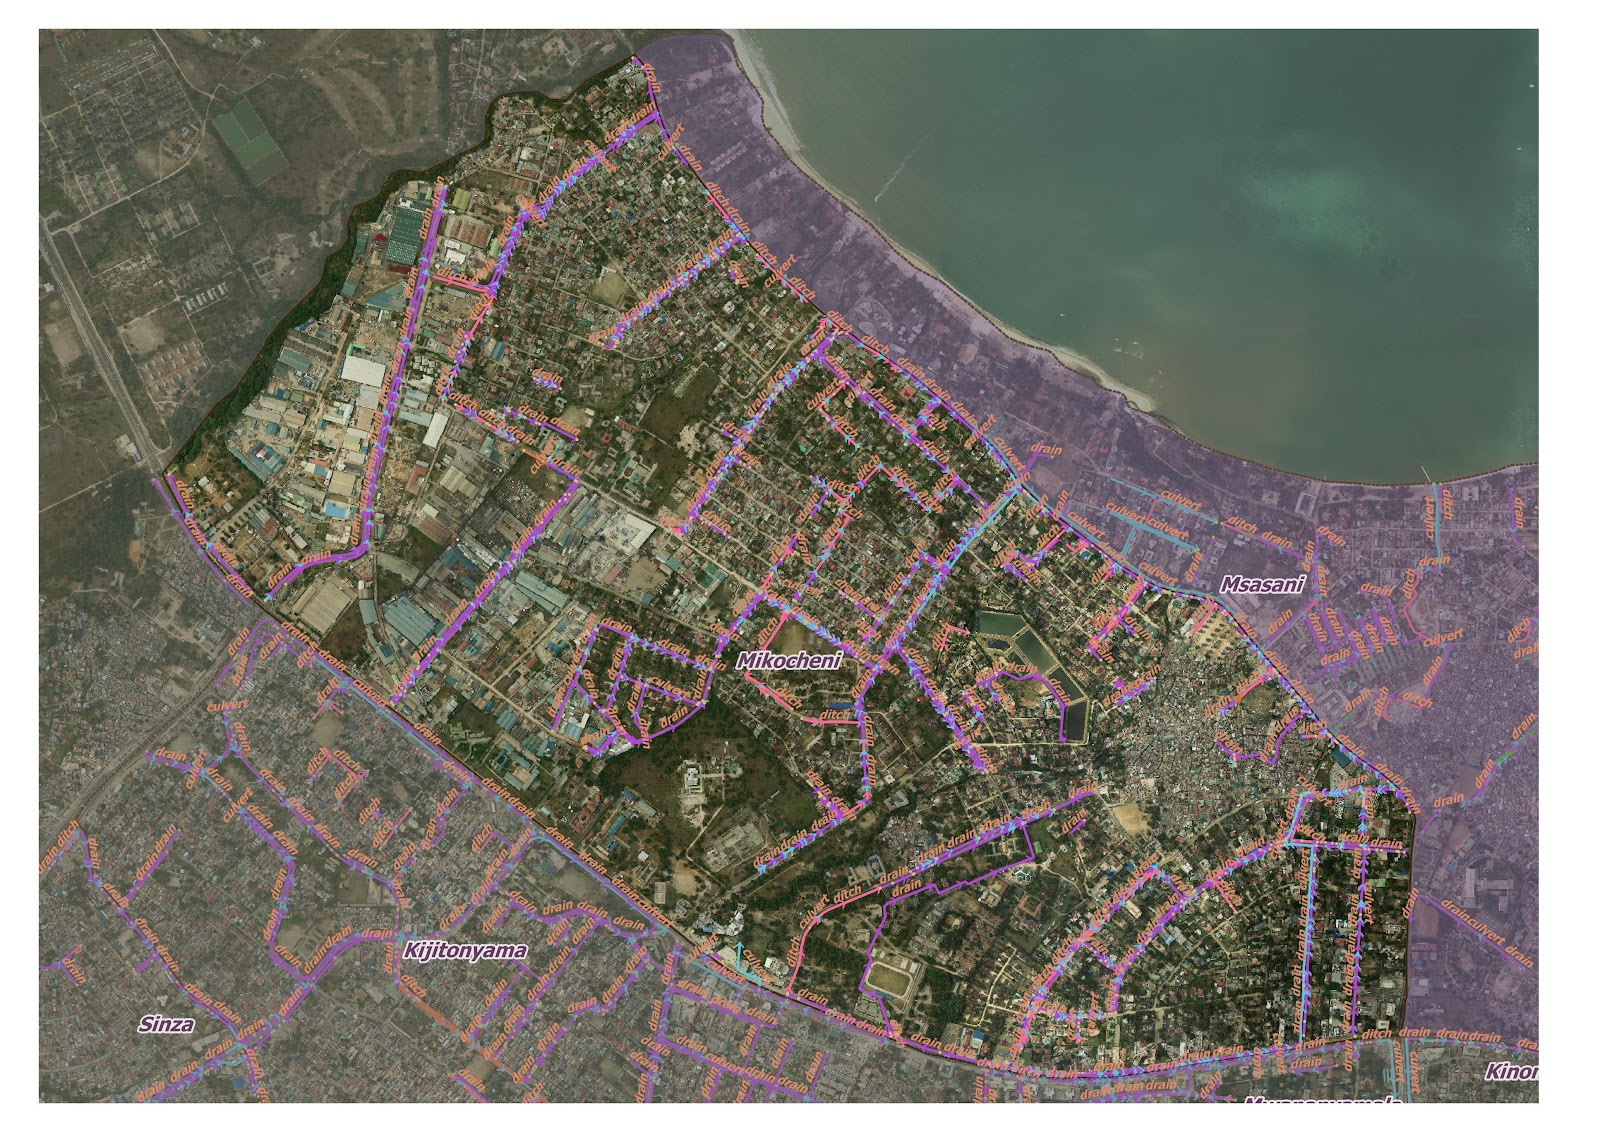
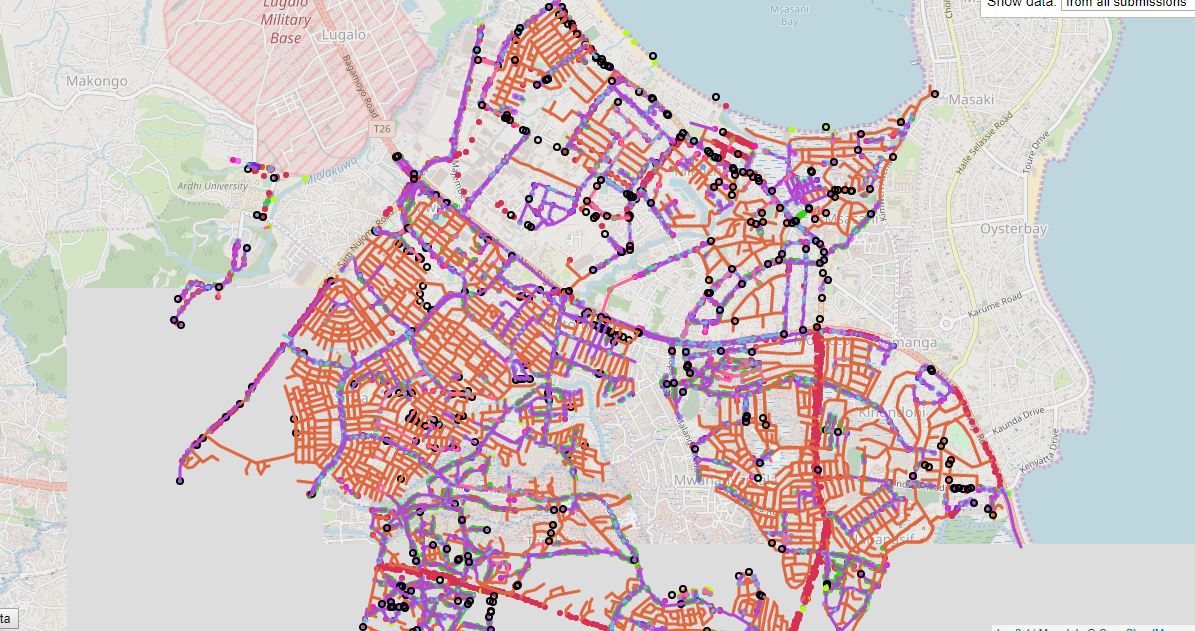
Drainage map of Mikocheni District
People
Many of the volunteers are graduates from Ardhi University in related fields who are taking part in Ramani Huria in order to improve their technical and management skills whilst contributing to improving their community. Ramani Huria is giving students the opportunity to learn new types of mapping such as using JOSM and Qgi, also the value of using community members in mapping.
Ramani Huria has been split into specific teams e.g. Drainage, Infrastructure, Community outreach etc., allowing volunteers to build up specialist skills. Sections of the project is divided into a data cleaning team and field mapping team, with supervisors who coordinate between groups to make sure that the data being collected is accurate. Speaking to the team, many of them had never been exposed to open, community mapping before. Now they feel that they can give back to their own communities whilst adding to the larger open mapping community. It is inspiring to see that after years of top-down approaches to international development, it is local people who are putting themselves on the map.
Mapping participants at State of the Map Tanzania
Communities
There is still a long way to go in terms of training the local community to understand how to use the maps. However, from what the team says, the communities do seem to be receptive when the field teams explain what they are doing when measuring the drainage systems in the city. The field teams are working hard to help local people understand the concept behind the projects and how maps can improve development initiatives and emergency response. The vision is for maps to be used by every ward and sub-ward leader to better support their local community so that people are able to locate themselves and the services they need e.g. health centres, schools, bus stations.
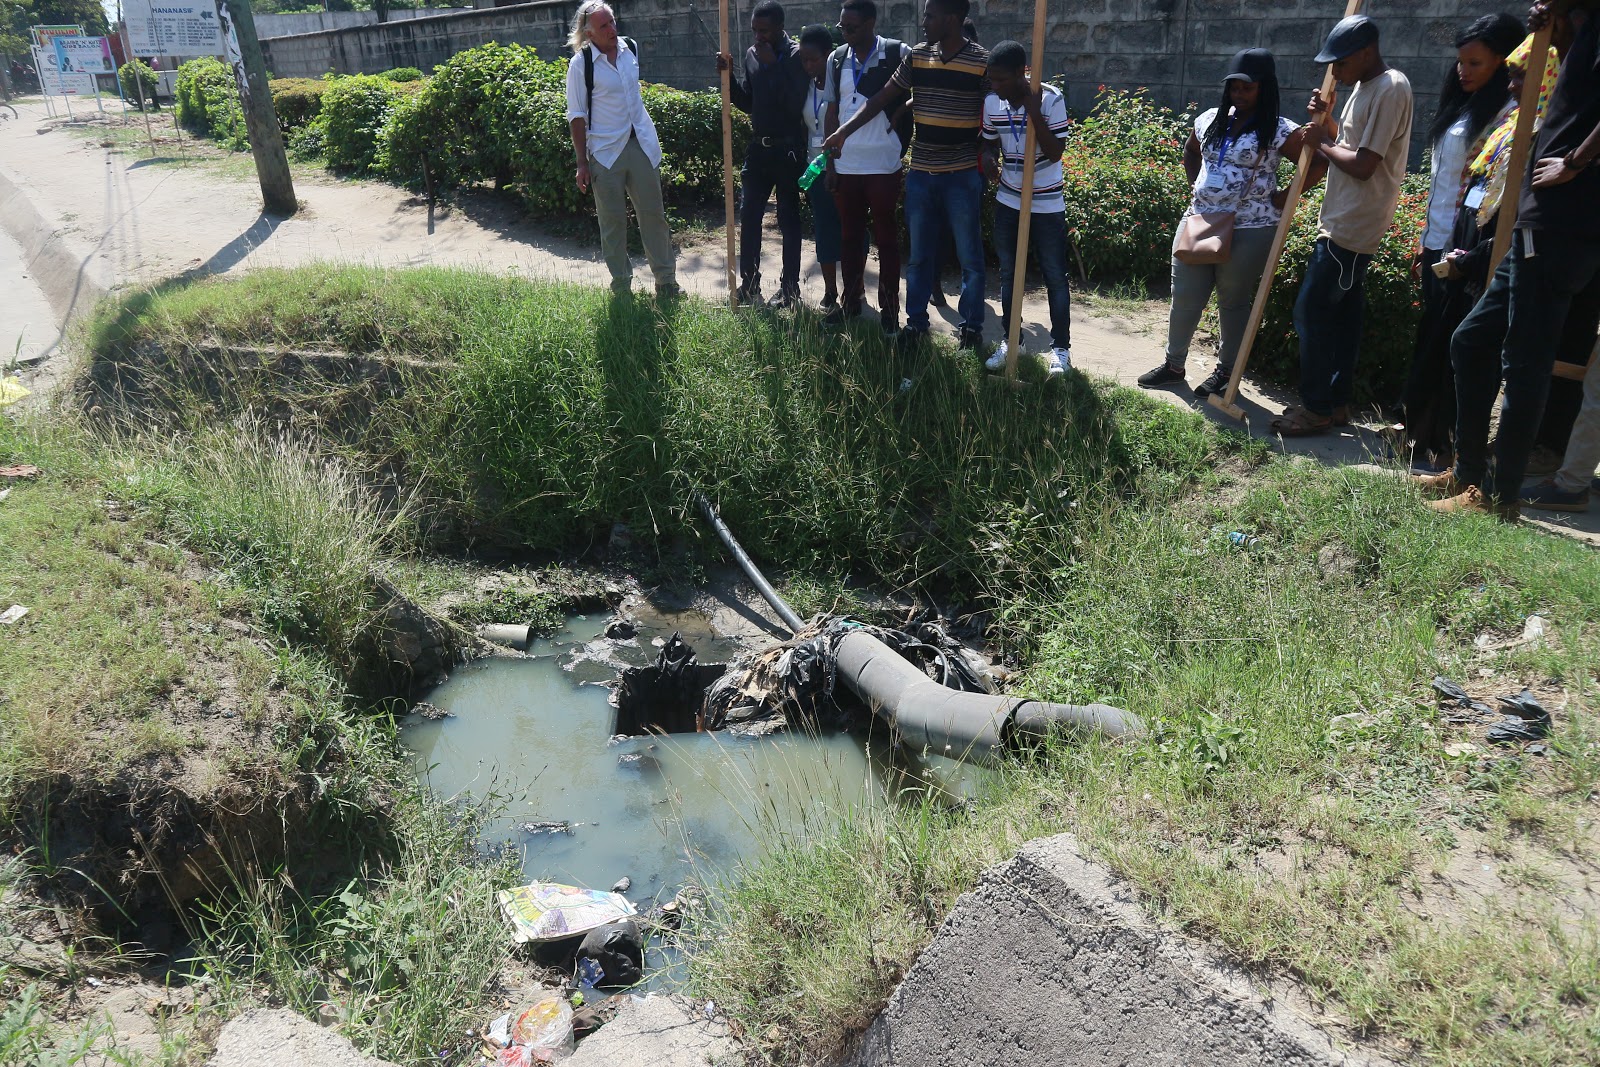
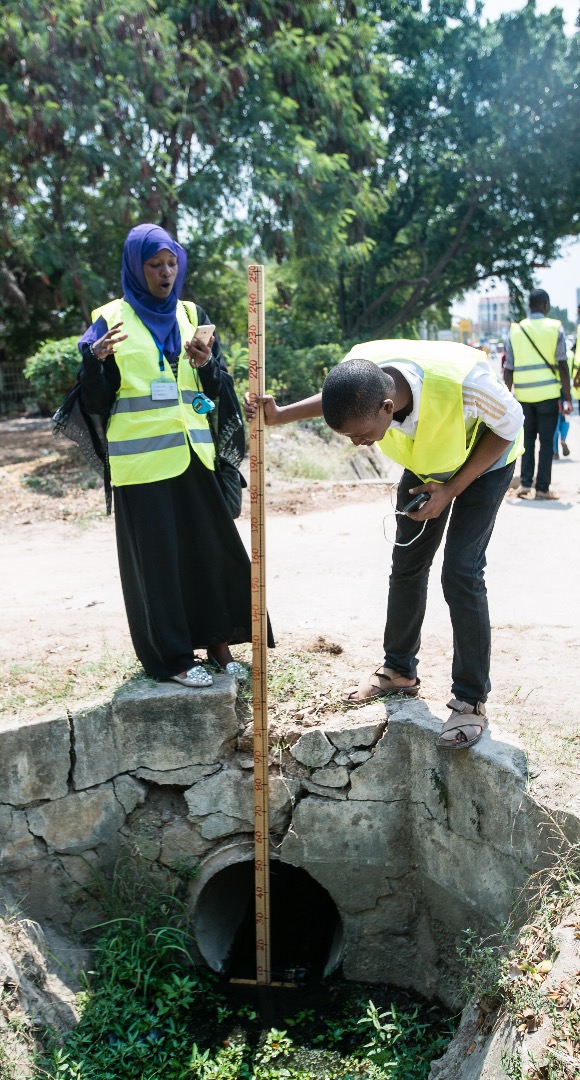
Field data collection team measuring drains and working with local community members
Overview of Initial Thoughts
While the initial motivation for the Ramani Huria project was to improve flood resilience in Dar es Salaam, it is clear that there are other benefits to the project. The project is upskilling the local people who are involved in the mapping, as well as creating a community of mappers. The way the projects operate encourage collaborative community working, which is a refreshing way to run a developing project.
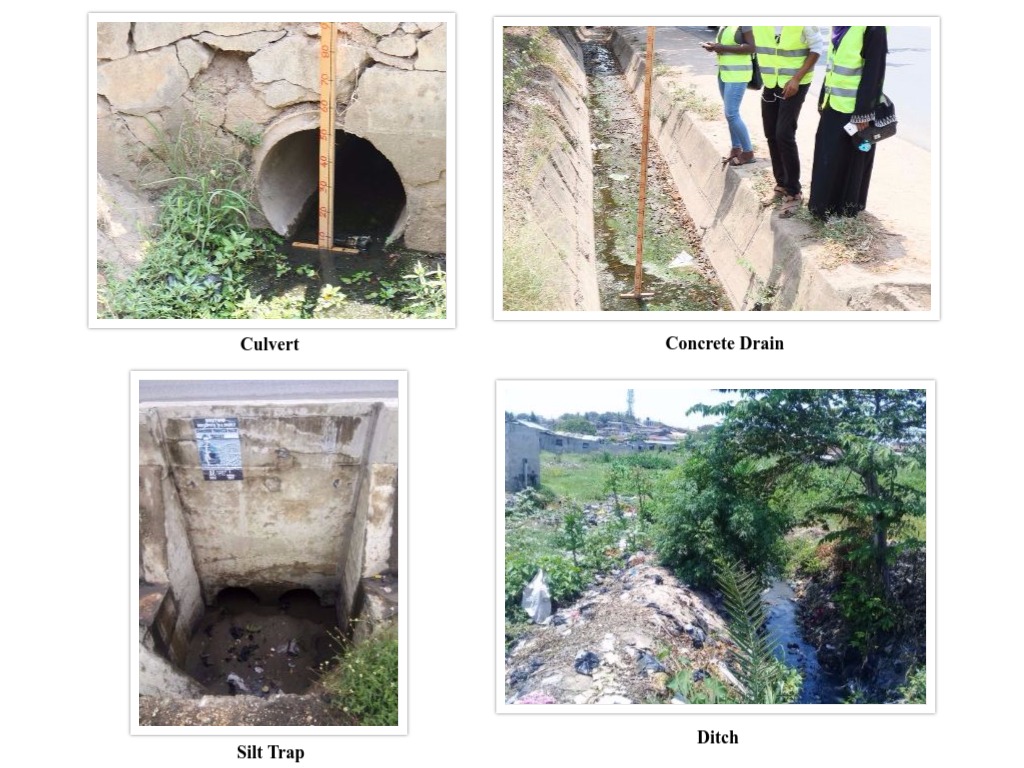
Ramani Huria 2.0 is collecting drainage information in the most flood prone areas across Dar es salaam. This information is used to develop a flood model which requires accurately collected specifications of drains such as depth, width, blockage (by either vegetation or material), connectivity, and diameter (typically for culverts).
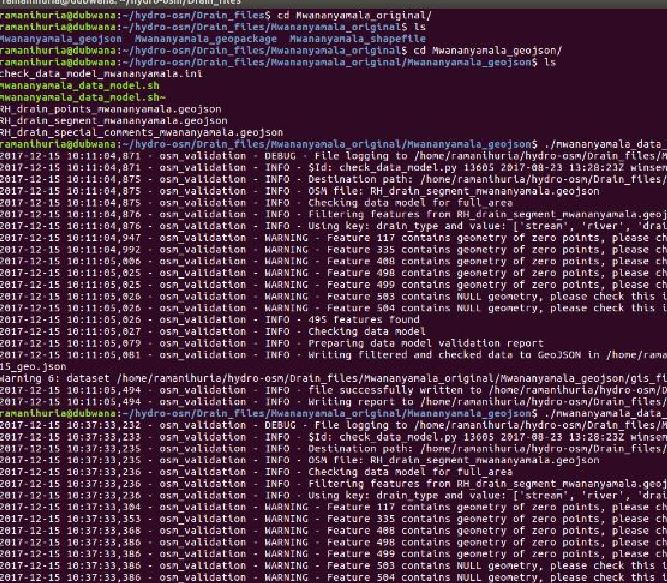
To develop this model, Ramani Huria is working with a hydrologist in Deltares– Netherlands, Hessel Winsemius. Dr Hessel is an expert in the field of hydrology, with particular applications in global and regional flood risk modelling. This week he was in Dar es Salaam, to look closely at flood modeling with the local team. One of the major issues that he noticed was how hard the team were working to deal with data quality assurance – they had to identify errors, missing data and warnings manually on QGIS by checking the attribute table of a specific segment. These issues which were time consuming, tiresome and not convenient. Critically, there’s no facility in QGIS that checks specifically for drainage connectivity, so Hessel created a Python-based utility called Hydro-OSM to do just that!
Drain Data Check Model
To make data quality checks more efficient, Hessel designed the Hydro-OSM data quality assurance model to automatically identify errors, warnings and missing information of drains. This method makes data cleaning easier than the previously employed method, and specifically checks attributes relevant to urban drainage. For cases of missing information or errors field teams will revisit the site and fix the error.
Hessel believes that if we are successful in developing the model it would be a stepping stone for decision makers in their effort of creating a flood resilient city. He’s also looking forward to helping the community develop flood models.
Hessel Checking the Functionality of the Model
The aim of all of this is to use OSM data to create a flood model (automated kind of procedure) to simulate how water moves from one place to another in an established network ie drain, ditch, waterway etc.
For the model to function, drains needs to be connected as much as possible. Although some drains in Dar es Salaam are not connected, Hessel is still working on this to see how unconnected drains can be included in the model.
All of this information needs a well developed or complete data model which Ramani Huria has already successfully established. More about the drainage data model that has been developed can be read on the previous blog here.
On the 8th to 10th December Crowd2Map collaborated with Ramani Huria to host the first state of the map conference in Dar es Salaam, Tanzania. We initially expected 150 participants but the number of attendees exceeded our estimates and reached 170 attendees from across 10 countries: Malawi, Kenya, Uganda, Rwanda, Zambia, Germany, America, Canada, Italy and Tanzania itself. It was an event where people from diverse background came together to train, network and interact.
Participants;
The great success of the conference came from the diverse background of the participants. The attendees ranged from University/college students, Youth Mappers, community mappers, researchers, Government officials, US Department of State (PEPFAR Program), organizations interested in using mapping to overcome different challenges, programmers and HOT personnel. All of these participants were very keen to learn from each other, network and understand how mapping can be a crucial part of their daily activities.
Presentation session.
The Ramani Huria team did a great job in organising the conference and Youth Mappers from different chapters were keen in assisting the newbies to the mapping. It was good to see one of the Youth Mappers from Uganda act as a training lead for the attendees on how to use JOSM and iD Editor in mapping.
Lightning Talks
There was a series of presentations to demonstrate why maps are necessary and how they are helping across multiple countries and projects. There was a presentation from PEPFAR describing how mapping is helping with their HIV/AIDS eradication programme. Ramani Huria spoke about their ongoing mapping project on areas most vulnerable to flooding and how the maps will be utilised for resilience and decision making. Map Kibera from Kenya presented on how mapping is helping in the provision of social services such as security, sanitation, health and education. The Kigoma Regional Executive Director briefed on the WASH (Water Sanitation and Hygiene) programme and how mapping is helping in the provision of social services in Kigoma. Researchers from Heidelberg University in Germany who had participated in the development of the application Mapswipe also gave a brief talk on how this app is making mapping easier.
Presentation – Ramani Huria
Country Manager- HOT Tanzania Mr Ivan Gayton gave a brief talk on the Mini-Grid project that is aiming at mapping villages viable for electrification by using solar power panels. This project is aiming to map villages that do not yet have electricity and help identify sites appropriate for renewable energy mini-grids. These maps can help solar operators move quickly to give access to renewable electricity to more Tanzanians. This is the power of what maps can do!
After these lightning talks there was discussions and networking among different Youth mapper chapters, who shared their experiences and discussed together what they can do as chapters.
Discussion and Networking
Mapathon
A mapathon is a coordinated mapping event. The public is invited to make online map improvements in an area to improve coverage and to help disaster risk assessment. Mapathons use an online site for storing map data, ie OpenStreetMap. During the conference we conducted a mapathon to map Manyoni District- a task created to map female genital mutilation. Participants were introduced to the OSM Tasking Manager and then trained how to map using Id Editor and JOSM software.
Mapathon
Workshops: QGIS, Map Swipe and Maps.Me
Participants were then introduced to the amazing open and free software that is used in mapping. People were very interested to learn about QGIS, but a day of training is not sufficient to make one able to produce a map in QGIS. What we were able to do, and which was a great success, was installation of the QGIS software to attendee’s computers, and making sure that they all know how to add shapefiles and the data that were used to make maps.
During QGIS session there was also a short presentation on drone mapping and the plan to map rural Tanzania using drones. The concept was presented very well by Mr Ivan Gayton where he highlighted the real need of the drone to help with emergency preparations. To have a complete and effective response cycle you need basemaps and the location of facilities. To build these basemaps you need to collect data from communities based on imagery that will be used for data collection. To have imagery you need a drone which helps complete the cycle by providing us with good imagery for data collection and hence these communities can better access help.
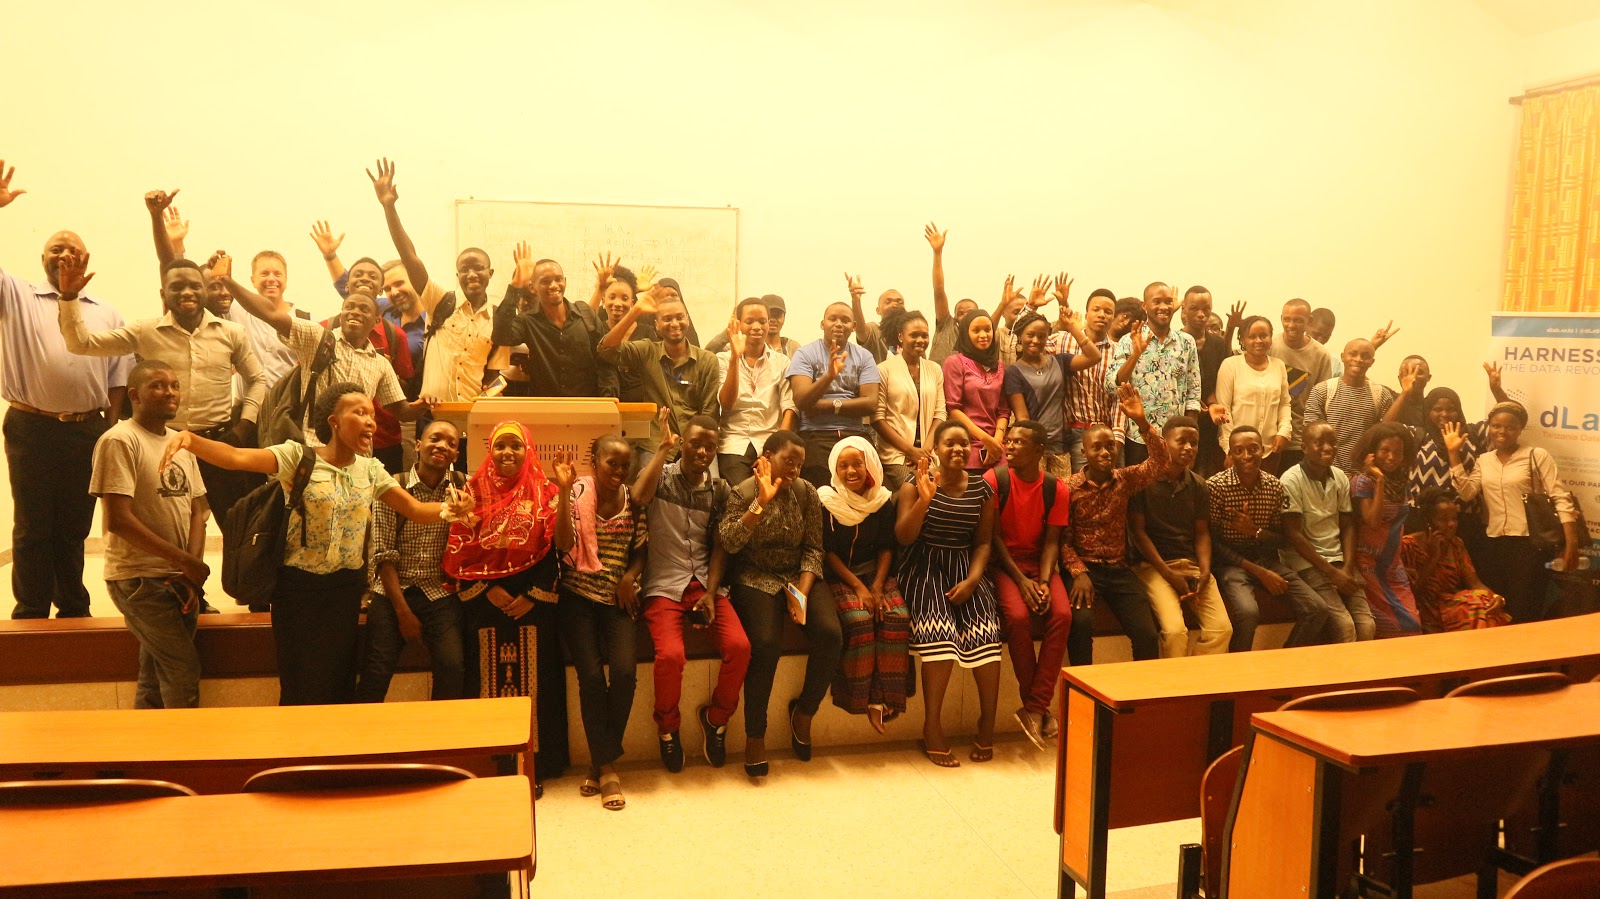
Group Photo with Drone
At the end of the Conference we had a football match- OSM Tanzania VS The rest of the world, and OSM Tanzania won the match.
Generally, it was a great experience to us as organisers and to attendees. We’re already looking forward to the second state of the map conference in 2018!
In honour of world AIDS day 2017, Ramani Huria and Data Lab Tanzania (dLab) co-hosted a maptime event to increase impact through transparency, accountability and partnership. The aim was for people to learn how to map to increase freely accessible public information on HIV/AIDS in districts across Tanzania. We decided to map Geita district in the lake Victoria zone as this district is one of the leading in Gender based violation and irreversible disability caused by such violation. It’s clear that areas that experience gender violation also have higher rates of HIV/AIDS transmission.
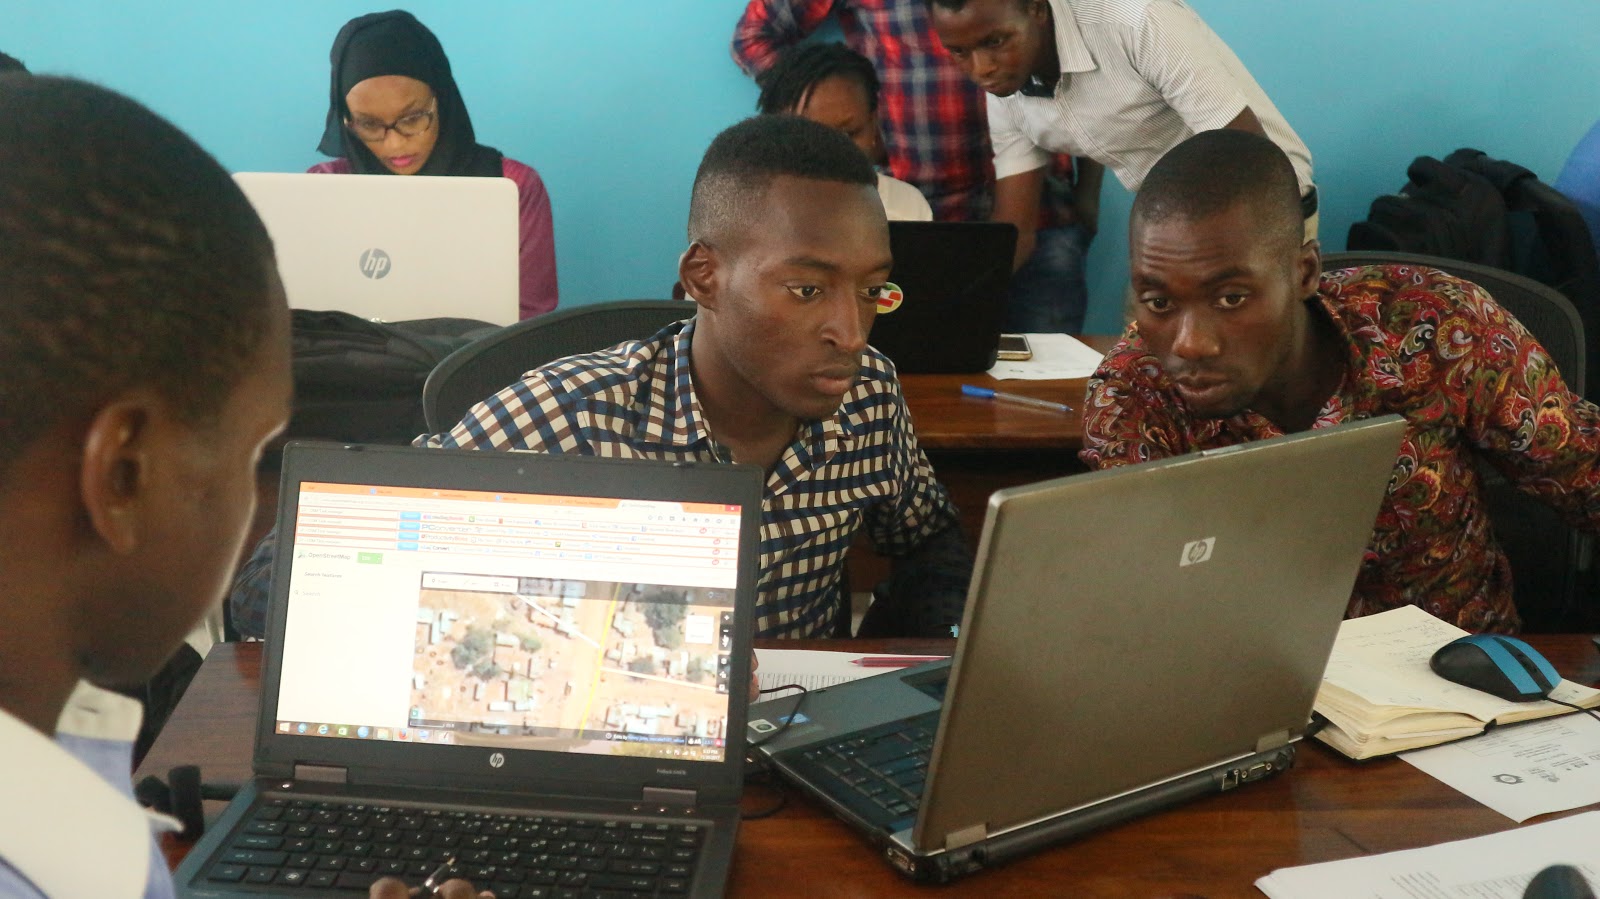
Mapping on progress
At the event, volunteers were introduced to why we conduct maptime events, and how we bring together mappers, volunteers and colleagues in the field to learn how to edit OpenstreetMap to create free accessible maps for local and global impact – in our case the focus was on HIV/AIDS.
Volunteers then received a briefing on the Ramani Huria project. They learnt how mapping is helping communities, and how the mapathon would help to generate data for the Geita people.
Before starting mapping, we made sure that everyone had;
Laptop, MacBook, or Desktop.
A mouse (to make digitization easier)
OSM account (one should have this to be able to upload information entered).
Internet connection.
Attendees were trained on how OSM works, and how to edit using JOSM and ID Editor. They were then introduced to OSM Tasking Manager. The OSM Tasking Manager is a mapping tool designed and built for the Humanitarian Openstreetmap Team collaborative mapping. The purpose of the tool is to divide up the mapping assignment into smaller tasks which can be completed rapidly. The tool shows which areas still need to be mapped and which areas need to have the completed mapping validated.
Volunteers began to pick mapping tasks from the OSM Tasking manager and started tracing buildings and roads to upload to the server.
To keep the event interactive and interesting, we conducted games such as OSM Fights. This game allows you to enter two user names which starts a funny fight between the two user names based on ‘How did you contribute to OSM’.
Announcing the ‘mapping Guru’ after every 30 minutes helped motivate the volunteers to continue mapping at speed. Of course, everyone would love to be a mapping Guru, so this created some competition between mappers.
Group Photo of Volunteers
The event was a real success and people were keen to find out when we would be conducting another mapathon for them to participate in. We are incredibly proud of how our mapping community is growing day after day.
Ramani Huria’s goal is resilience: to reduce the human impact of flooding. The most obvious way to do this is to reduce the likelihood of floods! Drainage is one of the ways to do so.
The drainage system in Dar es Salaam is enormous and complex, with hundreds of thousands of drains, often alongside roads, ranging from enormous 3-meter-deep concrete channels along highways to 5-cm-deep hand-dug ditches draining individual home sites. To help reduce flooding, we can map the drains and analyze them in specialized hydrological modelling software. This can allow us to identify problem spots that may need repair, redesign, or even simply cleaning by community members. In order to analyze the drains, we need more than just lines on the map; we need the profile (shape), dimensions, depth, material type, and surface roughness of the drains. Furthermore, the hydrological modelling software requires that every single segment of the drain map be connected; nothing can be missed or inaccurately positioned.
This type of mapping has traditionally been the preserve of highly-trained expert surveyors using expensive equipment. However, Ramani Huria sees an opportunity to work with highly skilled students from Ardhi University with community members with in-depth knowledge of their own neighbourhoods. This combination has resulted in data collection at an unprecedented scale, looking at the most flood-prone areas of Dar es Salaam.
PICTURE:Showing Hinge on Measuring Sticks.
PICTURE: Measuring Sticks and Tapes.
We first designed and built measuring sticks to effectively get the dimensions of the drains (ideally without spending a lot of time inside them), and purchases measuring tapes. However, though our smartphones have onboard GPS receivers, we were not aware of a software solution allowing us to capture lines as accurately as possible, as well as recording the various measurements and observations in a structured fashion.
The software we were able to find fell into two broad categories;
Programs specialized in recording GPS line traces, and
Programs specialized in data entry.
SCREENSHOTS: Various Android Mapping Applications
We couldn’t find anything that did both well. Several Android software solutions allow the user to record relatively high-quality GPS line traces (obviously within the limits of the device’s GPS accuracy), including an underlying map to see where one is, the ability to back up if the line loses accuracy partway through, and the ability to filter out points not meeting specified accuracy criteria.
SCREENSHOTS: OpenDataKit with Various Data Types
Several other programs, notably OpenDataKit (ODK) that we use extensively when mapping single-point features, allow the user to fill out form fields with specific types. ODK forms can accommodate numbers (integer or decimal), strings of text, selections from lists (single choice or “radio button” style, or multiple choice for selecting all that apply), and even photos from the smartphone’s camera. However, ODK’s feature for taking a GPS line, as opposed to a single point, was terribly inadequate. Whenever the GPS couldn’t find satellites, the ODK would drop back to using network location (calculated from the strength of nearby cell towers), which is usually off by hundreds or even thousands of meters (this resulted in lines punctuated with enormous jumps to random locations, which were unusable for map-making). Other problems included an inability to select the necessary accuracy threshold, no way to delete only the last few points (whenever anything went wrong you’d have to start again), no way to zoom in far enough to verify one’s position, and an output format that lacked both elevation and precision data (both available from the onboard GPS receiver on the phones).
Our choices were:
Use a map software such as the very high-quality free and open OSMAnd, and record all of the data in a single “comment” field. This would require enormous training and supervision to ensure that all of the complex drain data was recorded in a consistent fashion.
Use a data entry software such as ODK with poor line capabilities, and put up with the limitations. This would result in the surveyors spending much more time taking each line due to forced restarts, and would result in poor overall line precision.
Use one program to record the lines, and another to input the data. This would require very careful record-keeping to ensure that the data got attached to the right lines. Any time the indexes between the data and the lines got out of order, the entire dataset would be rendered useless and need to be re-done (potentially days or weeks of work).
Make a map software better at data entry, or a data entry software better at line mapping!
Enter Ka-Ping Yee, an extraordinarily capable software engineer with a keen interest in humanitarian work. Ping was vacationing in Europe when we called him to ask for help, and he agreed to spend a few weeks in Dar es Salaam volunteering his time with Ramani Huria.
We wanted our work to help everyone in the humanitarian mapping world, and therefore strongly preferred to use free/open source software(FOSS). We quickly settled on the strategy of adding better line-capturing capabilities to the free software OpenDataKit. ODK has for years been a towering colossus amongst Digital Humanitarian projects, largely due to the brilliance and commitment of the community of volunteer developers that maintains the app. We knew that if we added functionality to ODK, not only would Ramani Huria benefit, but the entire humanitarian sector would have access to our improvements.
Contributing to free/open source software is more complicated than it sounds! Before making changes to a project, it’s essential to reach out to the community that created and maintains the software. If this is not done, it’s very easy to duplicate work already being done, or even to make changes that are incompatible with or break other parts of the software. For that matter, sometimes open source developers have quite a strong emotional attachment to their projects, and can be defensive when someone tries to mess with the baby they’ve given so much love, time, and attention to, particularly if the newcomers crash in without introducing themselves and showing a little humility. Additionally, changes to software should never be made all at once, but rather introducing each change in isolation, including clear documentation, to allow for testing and review to make sure it doesn’t break things. Our planning for Ping’s code improvements spanned more than a dozen different changes, and would require packaging as individual [“commits”](some link to an explanation of git commits) as well as discussion and diplomacy.
We got in touch with Helene Martin, one of the ODK developers, and the ODK community was tremendously welcoming and excited about our work. Ping “forked” the “repo” of ODK, flew to Tanzania, and got to work.
There were a few major problems making ODK nearly unusable for line mapping. The constant jumping around of the position due to the network (rather than GPS) fixes, the inability to set an accuracy threshold, and the necessity of starting over anytime anything went the slightest bit wrong were most critical. Ping began by adding configurable accuracy filtering, and created a “backspace” button to erase recent points along the line (so users could simply back up a couple of points rather than starting over).
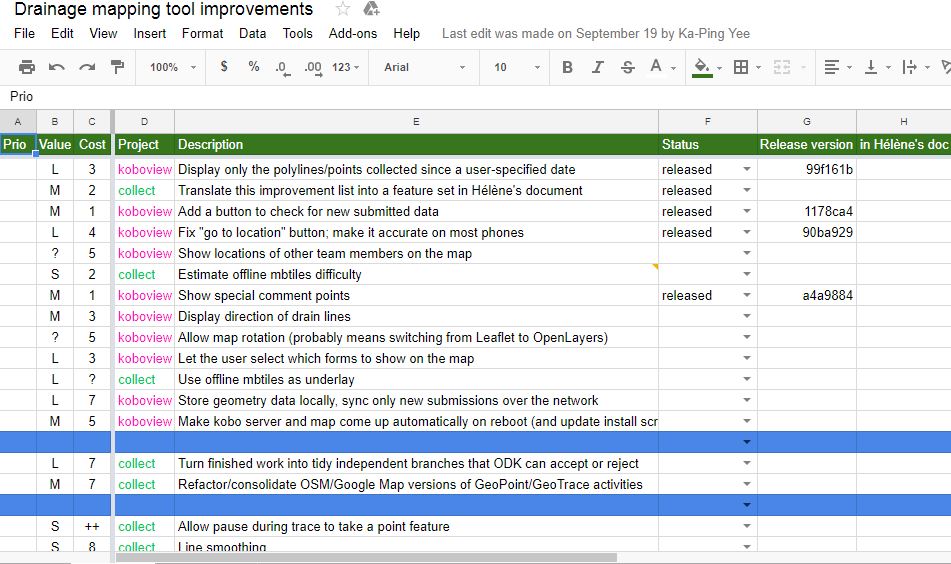
SCREENSHOT: The Prioritization Spreadsheet
Every day Ping consulted with Sadah, Felix, (DRAIN MAPPERS), Randy, and Ivan to see what changes would most benefit the team’s work. This was a delicate balance between changes that would have the most impact and those that would take the most time; the “quick wins” (high impact and easy to implement) were exhausted quite soon.
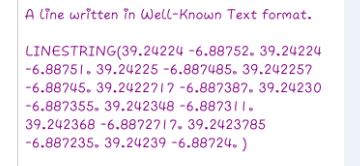
A few issues turned out to be far more complicated than anticipated. For example, ODK exports line traces as a series of points defined by nothing more than four numbers (latitude, longitude, elevation, GPS precision) separated by commas, with semicolons between the points. Mapping software doesn’t know what to make of this series of numbers without context, so we changed the format to Well-Known Text (WKT), a geographical text data format that mapping programs such as QGIS, the amazing free-software mapping system that we use, can easily recognize and display.
SCREENSHOT: Some WKT String Examples
However, we discovered that this broke ODK! Whenever a user re-opened a survey after saving it, the WKT linestrings had vanished. It turns out that the form-definition language that ODK is based on, Javarosa has a specific grammar for lines – the aforementioned series of four comma-separated numbers with semicolons between points – that doesn’t correspond to WKT (or any other geographical format that we are aware of). Without making major revisions to Javarosa (which would almost certainly break other things, probably mostly for people far away who would never know what we’d done to them, but who would really hate us if they found out), we simply couldn’t implement WKT linestrings in ODK. We had to “revert the change” and go back to the original implementation that produces output that can’t be opened in a mapping program. To solve, or at least mitigate this, Ping wrote [a conversion utility plugin](github.com/zestyping/THE LINESTRING PLUGIN) for QGIS to convert the Javarosa lines into proper Well-Known Text.
The Old ODK Line Trace Interface The New ODK Line Trace Interface
Many technical changes later, we ended up discussing an entirely new issue: the mappers in the university lab trying to make sense of the field data on their computers were finding missing segments and points. The surveyors in the field, despite enormous efforts, especially by Sadah, Felix, and Randy, were still missing occasional features. It was rare, but still enough that the datasets to be sent to the hydrological consultant for analysis were not sufficiently complete and connected. The supervisors were unable to ascertain whether all features had been captured whilst in the field, and had to wait until the computer mappers in the university lab opened the data. We wondered, “what if the surveyors and field supervisors could see every segment and point in real time, so that any missed features can be captured before leaving the neighborhood?” So Ping built a final cherry on top of the cake: an online supervisor’s portal displaying the line segment data in real time in a Web page, either on a laptop or on a phone!
SCREENSHOTS: Kobo Viewer on Laptop
SCREENSHOTS; Kobo Viewer on Phone
Finally, we have a software solution capable of capturing GPS lines to the level of accuracy and efficiency we need, the incredible capacity of ODK to input precise data types, and a supervisory tool to help teams complete fully connected drain maps. However, it’s not yet time to celebrate, much still must be done. The “fork” with all of our changes to ODK has not yet been integrated back into the main ODK codebase (discussion with the ODK community is ongoing, and more work needs to be done on documentation and packaging). We have mapped seven wards of Dar es Salaam using our methods, but only a small fraction of the mapping has been validated by the hydrological software consultants in the Netherlands; we need to ensure that our work is fully fit for purpose before scaling up to the rest of the city. Finally, we need to document all of our work, package it up, and prepare a playbook for anyone else in the world that could improve urban drainage using community-based mapping!
While Ping worked on software, Randy Jones, a Canadian volunteer who led the drainage team in the field for the first month, has been building a Wiki-based playbook for practical community-based urban drainage mapping based on the methods we’ve developed in Dar es Salaam with Ramani Huria
We hope that Ramani Huria’s work will benefit populations all over the world endangered by floods. Our team right here in Tanzania will be leading the way!
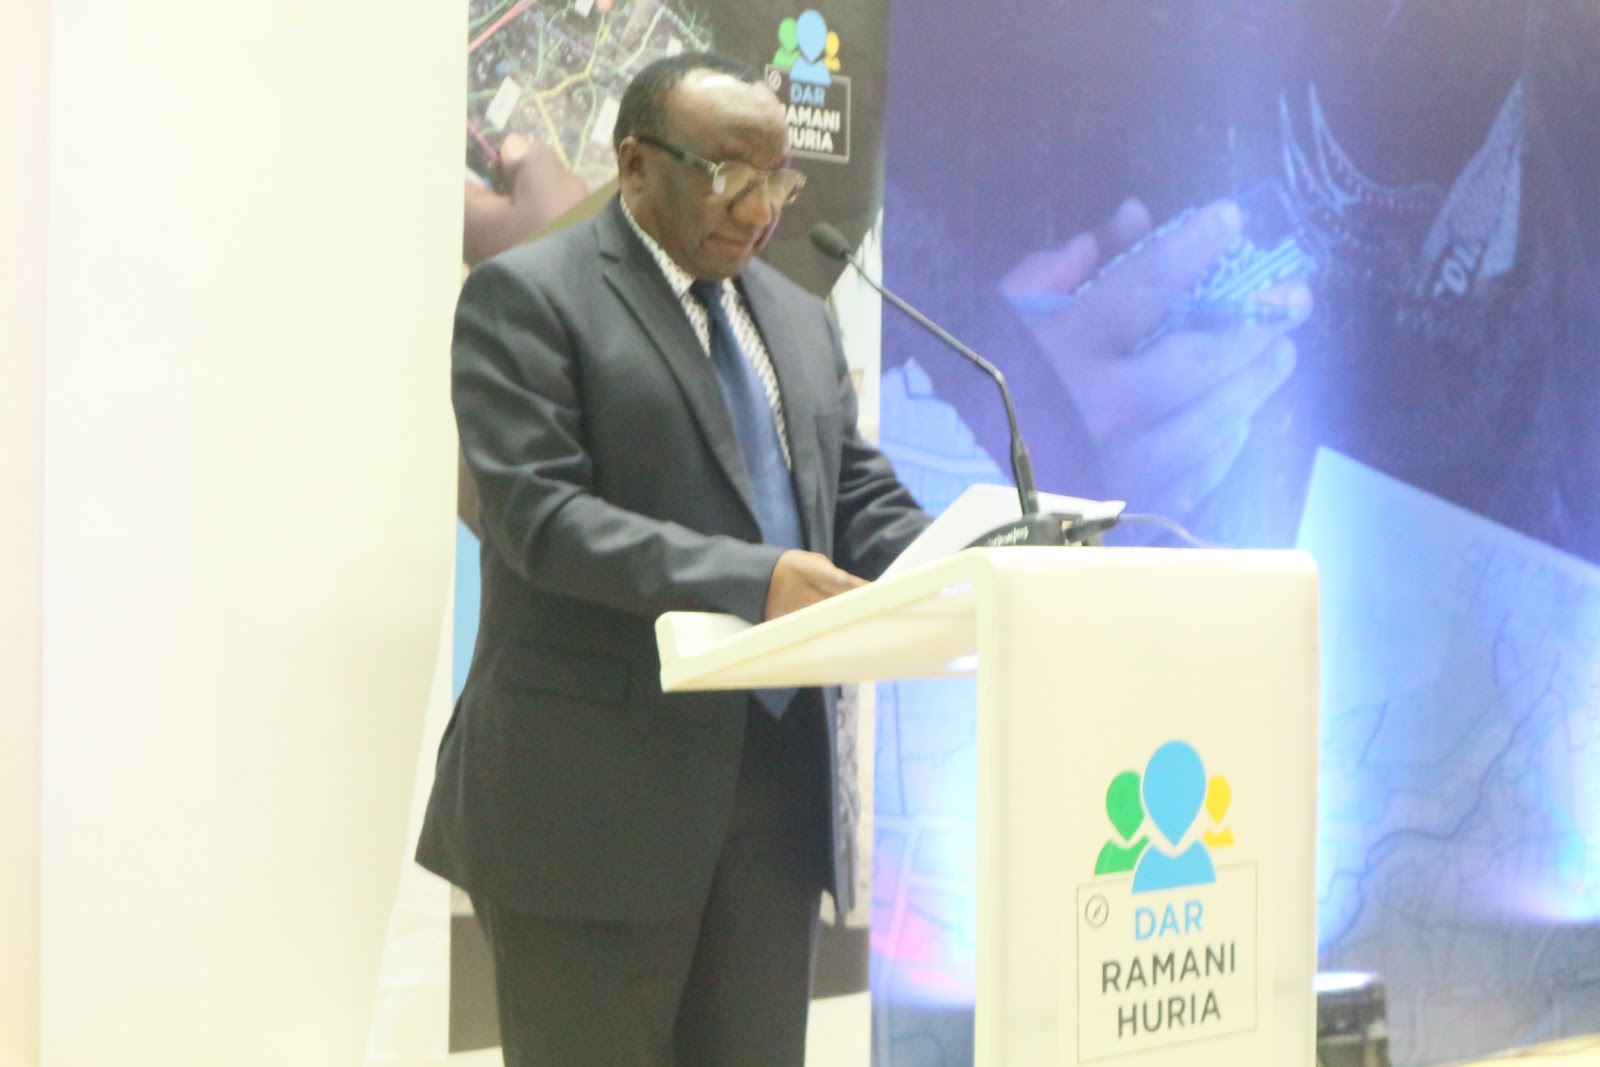
On September 26th, the new era of Ramani Huria 2.0 was officially launched at Julius Nyerere International Convention Center, an event attended by key project stakeholders, including government officials, university officials, Red Cross members, mapping experts, community members, and, of course, the students of Ramani Huria.
Professor Evaristo Liwa, Vice Chancellor of Ardhi University, gave opening remarks that commenced with a briefing on the previous iteration of Ramani Huria – a project that successfully produced maps for 21 wards of the city, home to approximately 1.3 million residents. He noted that this scaled up phase is expected to reach over 3 million residents of Dar es Salaam, doubling the pilot’s initial impact.
Professor Liwa’s speech focused on the role that collaboration has played in this project – highlighting the partnership between Ardhi University and the World Bank that has now transferred knowledge and skills in disaster risk management to over 400 students. “Through the support from World Bank and the Ramani Huria project, a good number of Ardhi University graduates have become professionals and employable in different sectors,” he reported.
Professor Evaristo Liwa-Vice Chancellor of Ardhi University Opening the Workshop
Mr. Michael Ole-Mungaya, Representative of the Regional Administrative Secretary, was next to praise the project, now the world’s largest community mapping campaign. He commenced by noting that Dar es Salaam is a rapidly expanding city with a growing problem of inadequate waste collection, among other contributing factors to flooding. Following this, he urged that support for Ramani Huria continues from all sides, as it is through such collaboration that we can make our city more resilient.
World Bank Country Director, Ms. Bella Bird, further reminded us that Tanzania is the most flood-affected in East Africa, and that this burden weighs heavily upon the population from both a social and economic perspective. She emphasized the importance of scaling up a project like Ramani Huria and was happy to report that the World Bank will not cease its support.
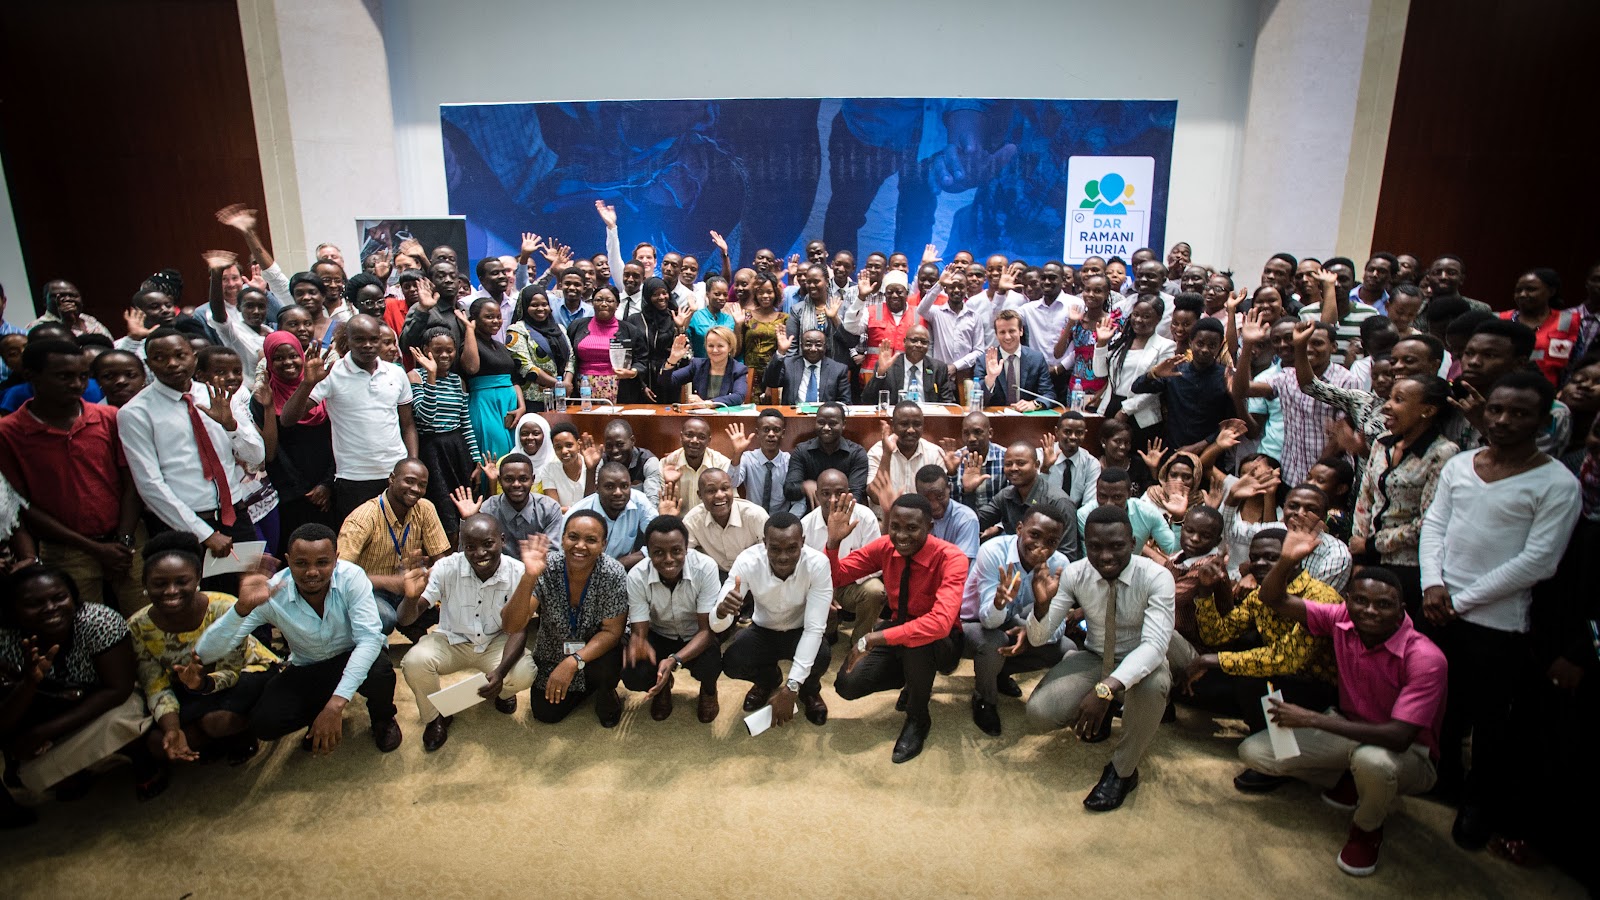
A group photo of attendees.
“What makes Ramani Huria initiative unique,” Thomas Allen, Deputy Head of the UK Department for International Development (DfID), continued, “is Youth and Innovation”. Like Ms. Bird, he added that the UK is delighted to support such an initiative in its broader goal of improving urban resilience across the country.
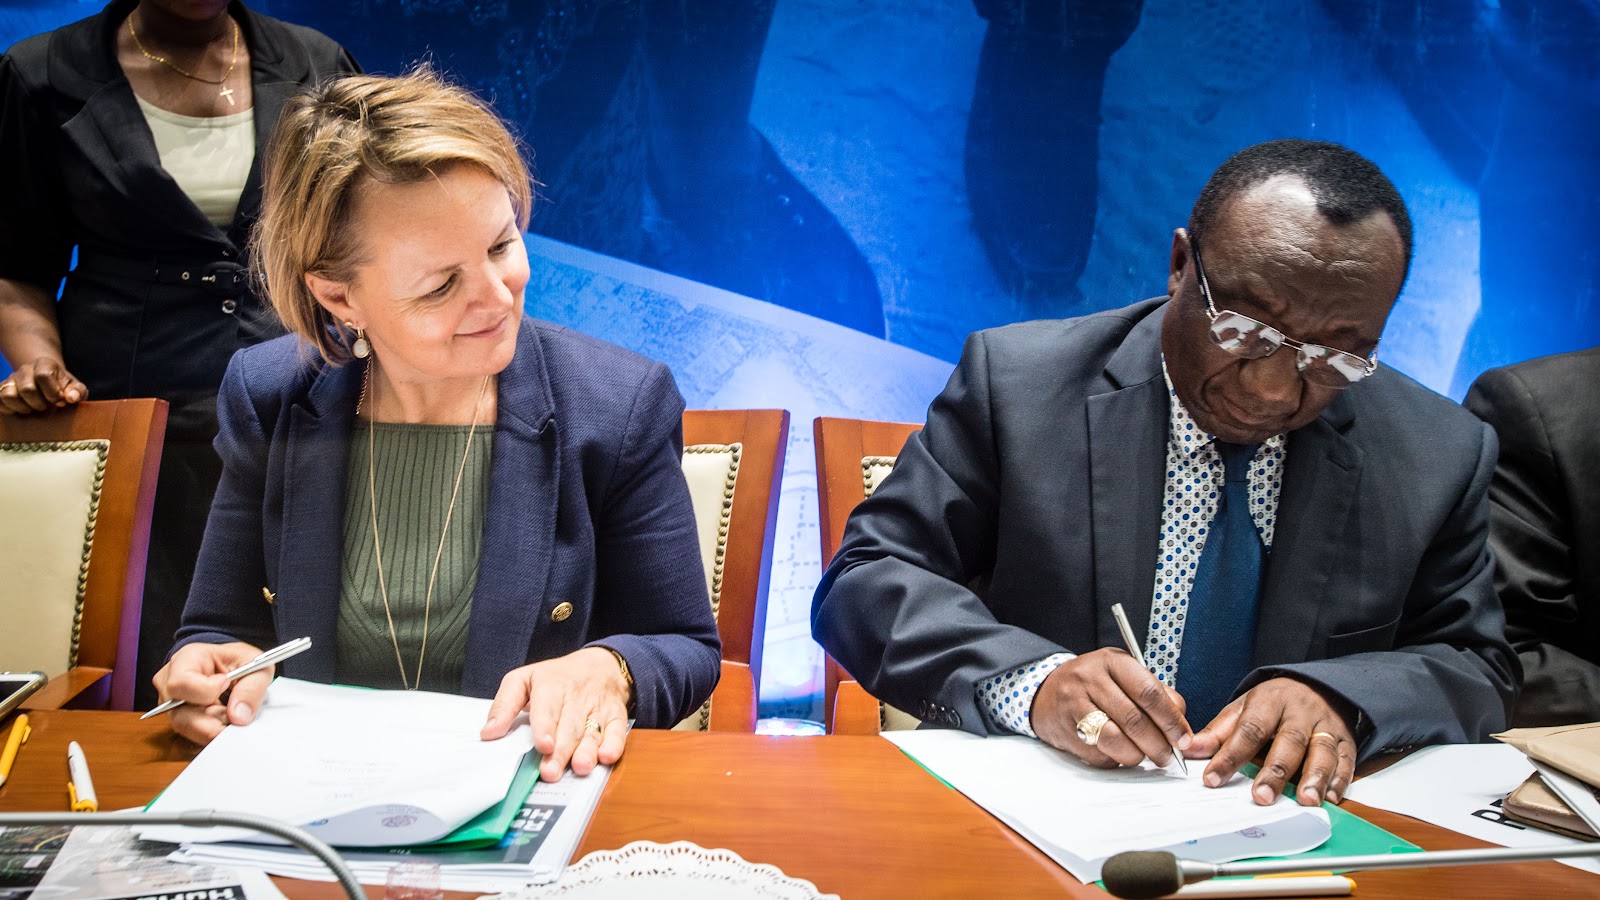
To conclude the ceremony, a Memorandum of Understanding (MoU) was signed between Ardhi University, The World Bank, and DfID as a formal agreement to increase cooperation among these partners for improving youth access to practical education on disaster risk management.
Signing memorandum of understanding
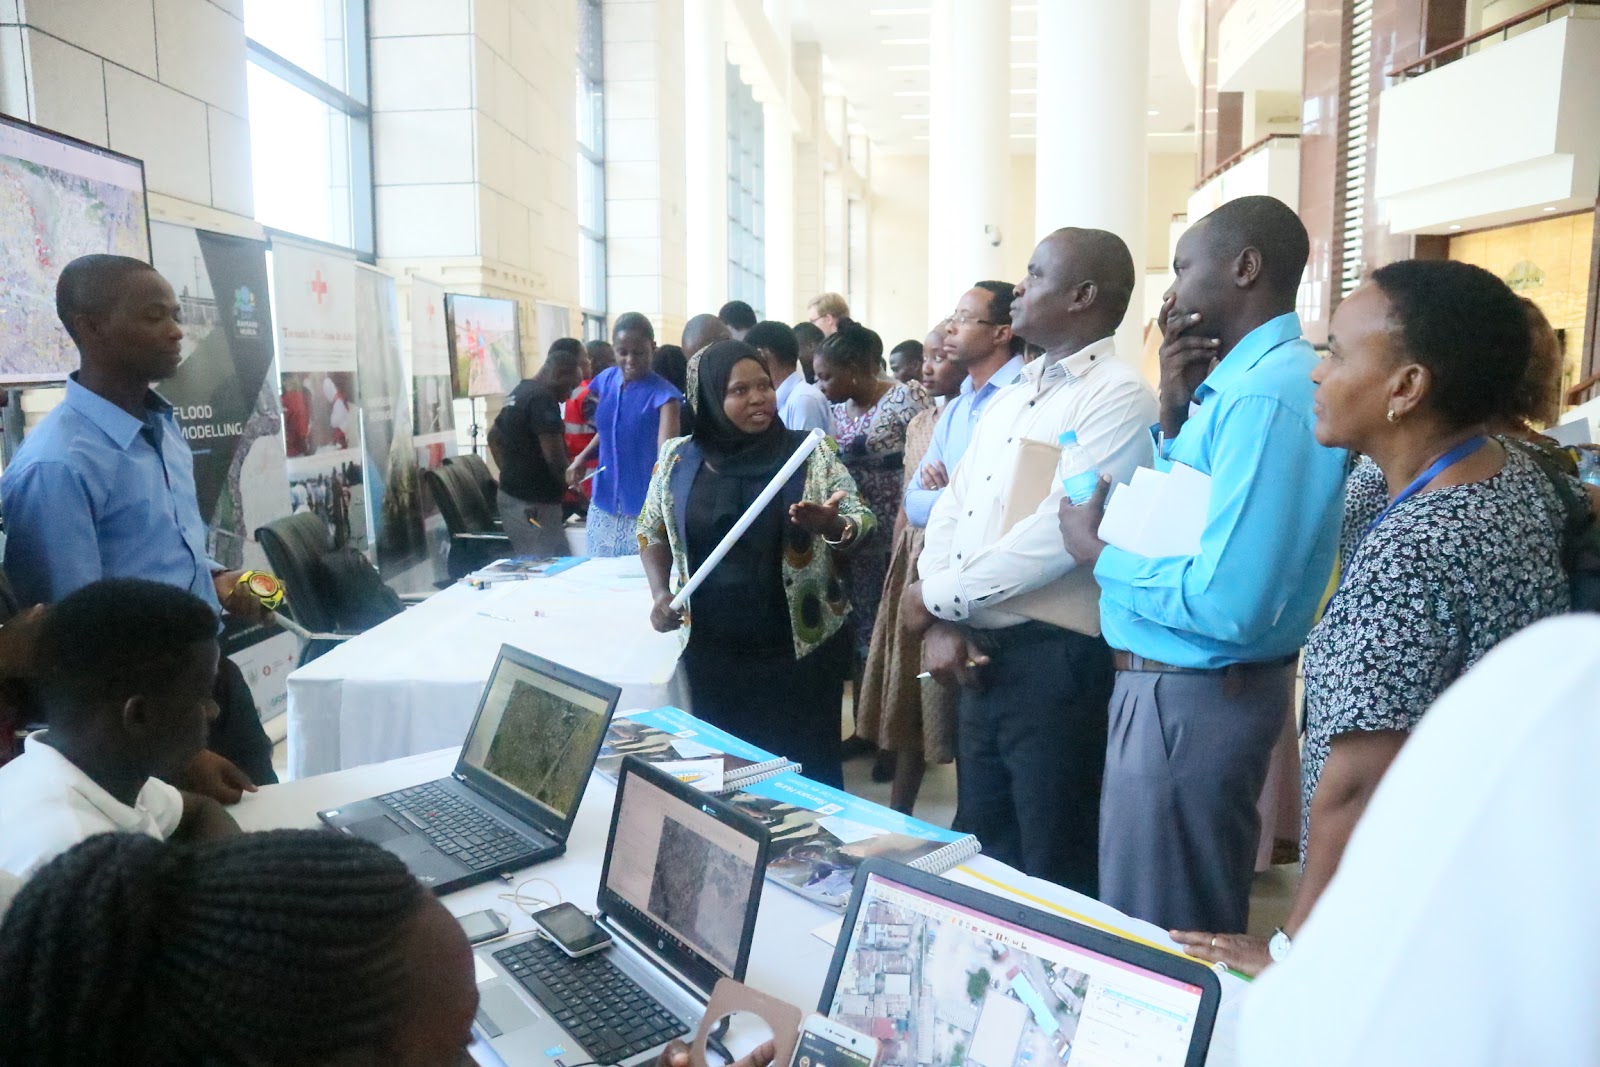
After a celebratory group photo, participants were then invited to attend an exhibition of the work that Ramani Huria 2.0 ha accomplished thus far – including drainage mapping, flood extent mapping, infrastructure mapping, and emergency response.
One of the primary tasks of Ramani Huria is to assess flood extent across Dar es Salaam – and community engagement is at the heart of this activity. It is through this engagement that we have access to well-informed local knowledge, adding a level of depth to our identification of flood-prone areas that can only offered by the community itself.
Using information gathered out in the field, we are further able to create a time series – advancing the possibility of identifying historical trends of Dar es Salaam’s flood extent. Through this method, we are able to assess how the flooding situation may have changed over the years, and student-community member interactions are essential to its productivity and scalability. Future completion of the surveys will be based upon links formed between community members through this project.
How it works:
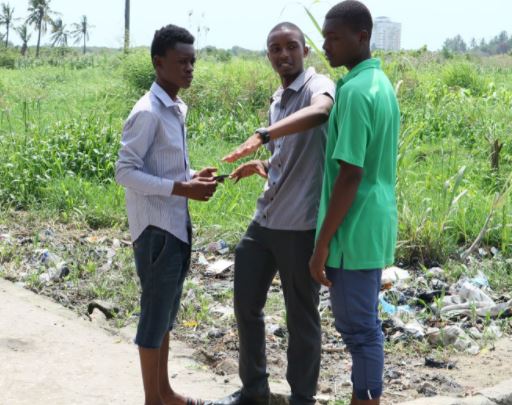
After consulting with the appropriate subward leaders, students go door-to-door and explain the project to community members. If the citizens are interested, the students will then show them how to operate the Opendatakit Collect (ODK) app and ask them to fill out the survey form accordingly. Scratch cards and cash incentives are provided to those who carry out surveys, as a source of motivation for community involvement in working with us.
New community members are brought down to the river by the students and directed through the app. From their point on the river, the community members are instructed to walk directly away from the river to survey houses along the way – identifying whether or not they are hit by flooding. The student accompanies the community member for 1 or 2 houses and then leaves the trainee to continue on solo to complete the survey. This serves as a transect-like data collection methodology.
A student explaining to community member how the work is done
Once the community members return from their mission, the team then supervises the exchange of knowledge between the community members themselves. The returning community members thus become teachers and help to recruit more citizens to the activity.
Challenges:
This activity is, of course, not without some challenges. The misinterpretation of survey question wording was identified as an issue early on – eg. for ‘have you experienced flooding?’, some members were answering about experiencing flooding at a previous address. Rewording and clarifying has been imparted upon all community members and students conducting further training.
Some community members have additionally been reluctant to cooperate due to distrust of / lack of recognition of the student surveyors. This is an issue that we have worked to address by providing introductory letters regarding the project.
Other community members have moved house due to flooding events and exposure, so some GPS points cannot be attached to recollections of flooding. It could be an interesting exercise to find out how many people have moved in response to flooding to see how flooding events have impacted the community demographics.
Results:
Despite challenges, the numbers of surveys reached is far beyond what we hypothesized to be realistically possible. The growth in survey numbers per day has been striking – beginning with just about one hundred surveys in one day to as many as 840 in one day, growth that took place within just 8 days. This not only proves how fruitful community engagement can be, but how quickly we can secure progress. Any initial hesitations about the project’s ambition have been overridden by the climbing survey figures, suggesting that an even larger scale will be achievable. Until now, we have more than 9000 surveys complete.
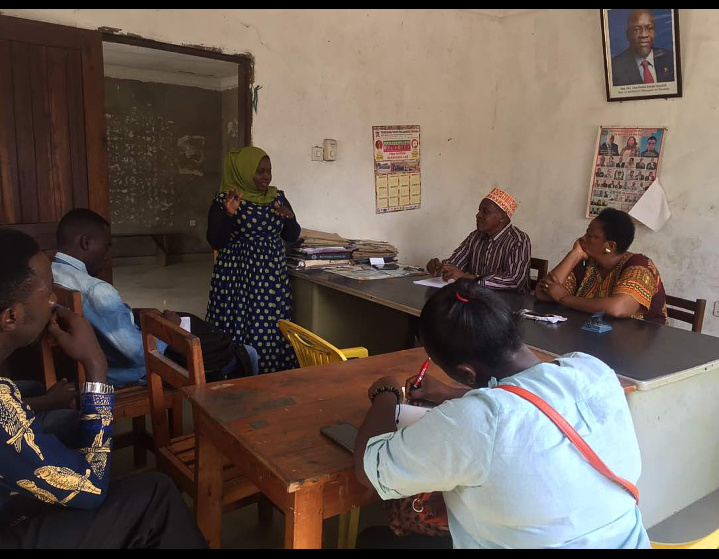
With growing support from community members, we brought 8 of them (from Hananasif and Kawawa) to Mkunguni ‘A’ sub-ward to observe how we interact with the subward leaders. Following the methodology set by the students in the first wards visited, community members actively engaged with subward leaders, inquiring about the subward boundaries and posing questions about the area. We then arranged a meeting with community members and ward officers, as we are aware that it is through the forging of these relationships that the project will achieve sustainability.
Meeting with Sub-ward leaders.
In the process, it has been discovered that poor and/or disrupted drainage systems are being identified as contributory factors to flooding in areas relatively far away from the river itself. These factors have been identified through the active engagement of community members by student surveyors – after looking at the data and collectively identifying points where flooding seems unlikely. This is why addressing flooding is a very complex issue that needs wide collaboration among respective actors, the Ramani Huria team being among them.
Community mapping efforts in Dar es salaam and southern part of the country are enabling local leaders to leverage information about the most granular level of community administration that exists in Tanzania but were never mapped before
This boundaries which offers Health workers, local communities and leaders unprecedented information about the most granular level of community administration that exist in tanzania that can be used to track individuals within a smallest unit of population especially when it comes to the need of tracking patients original and find the source of diseases. This would help health workers in planning for outreach and interventions.Also by using these data, epidemiologist can see the spatial distribution of reported cases.
Many informal communities remain relatively unmapped -with little knowledge about how many people are within safe walking distance to health care facilities.This make it hard for workers ,emergency responders and planners to make informed decision about where to prioritize investment advocacy and outreach. this far reaching implication for access basic services such as healthcare and maternity services.The data collected has far reaching implication for public health planning ,local administration,economic evaluation and disaster prevention.
One of the main goals of Ramani Huria 2.0 is to scale up all drainage mapping efforts that were previously executed during the project’s pilot. Students have now been grouped into specialized groups to ease coordination and delegate according to skillset. These groups include: Drainage Team, GIS Team, Open MapKit Team, Community Outreach team and Remote Mapping Team.
There was no clearly identified method for mapping drains, so our team had to test most of the known field mapping applications. After testing these applications, the GeoTrace feature, coupled with its ability to enable the creation of customized surveys, placed the OpenDataKit (ODK) tool on top of all tested applications. This is a free and open-source Android application that helps organizations to gather data and manage mobile data collection. A data collection form or survey is built (XLS Forms is recommended for larger forms) and collection of data is done on a mobile device. It is then sent to a server, which aggregates the data and makes it available for extraction in a useful format.
After creating the appropriate form, students were trained to use ODK on their own Android phones. OSMAnd is another application that helps field mappers to properly orient themselves as they move around the city mapping, and the GeoTrace functionality is incredibly helpful for mapping of drains, ditches, and culverts, and accurately taking coordinates as a mapper moves along the feature being mapped.
.
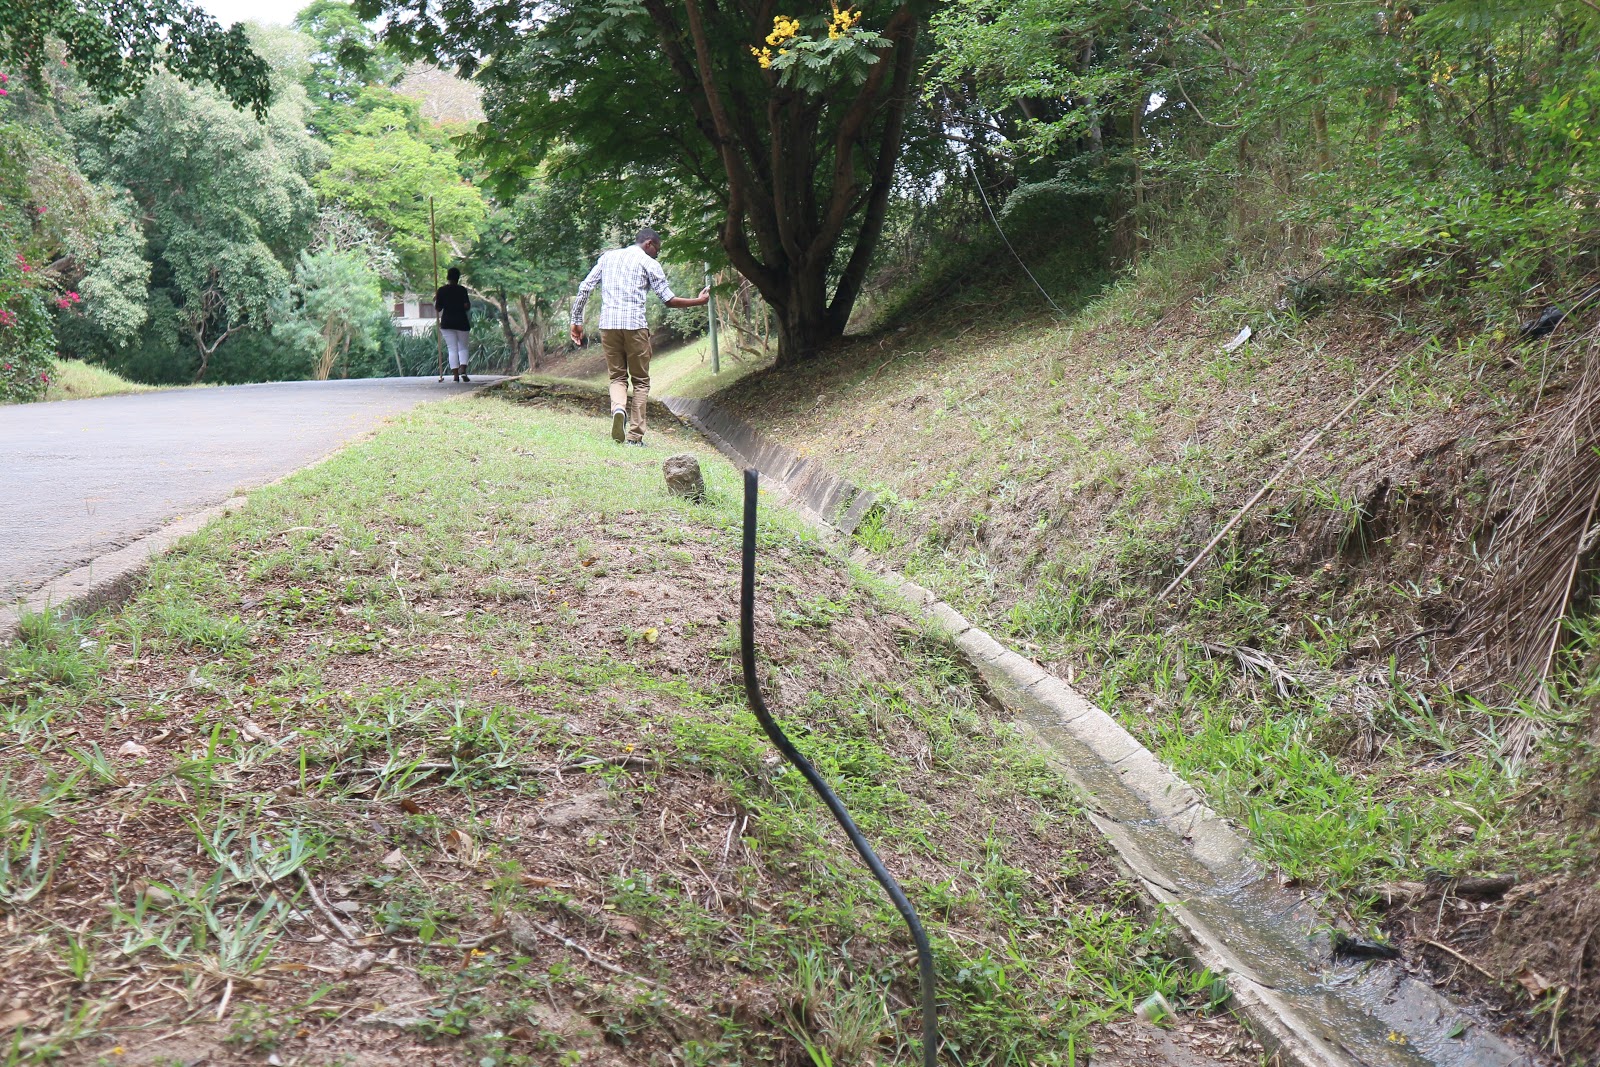
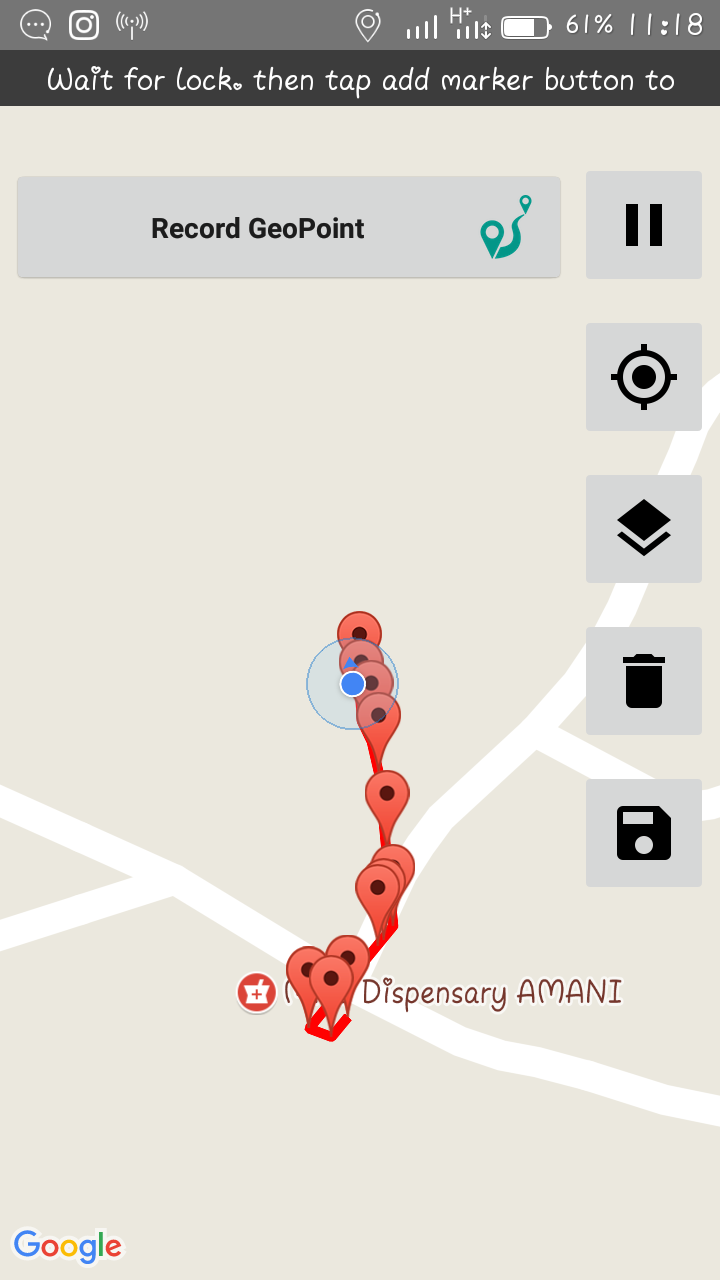
A student tracing a drain.
Additionally, while mapping, mappers use ODK to take GeoPoints to accurately locate features in or along the drain segments. These points include: drain beginning point, drain damage or blockage, point where drain connects to private property, spillways, silt traps, drain outflow point, and many others.
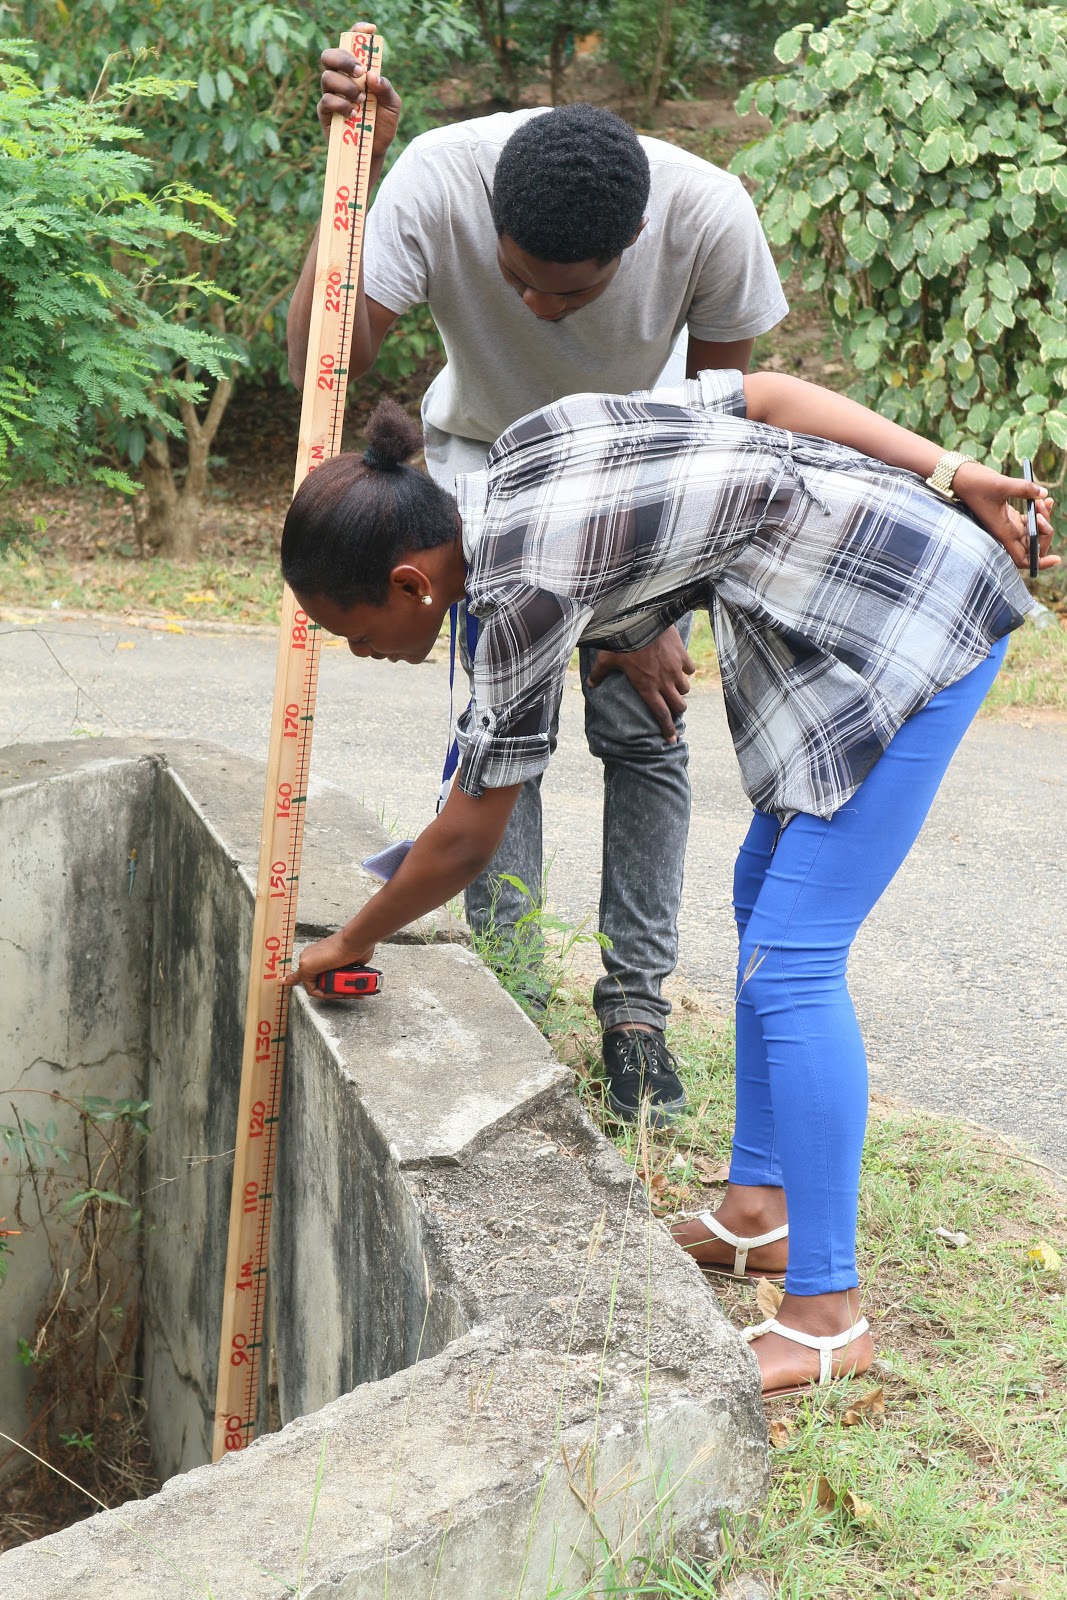
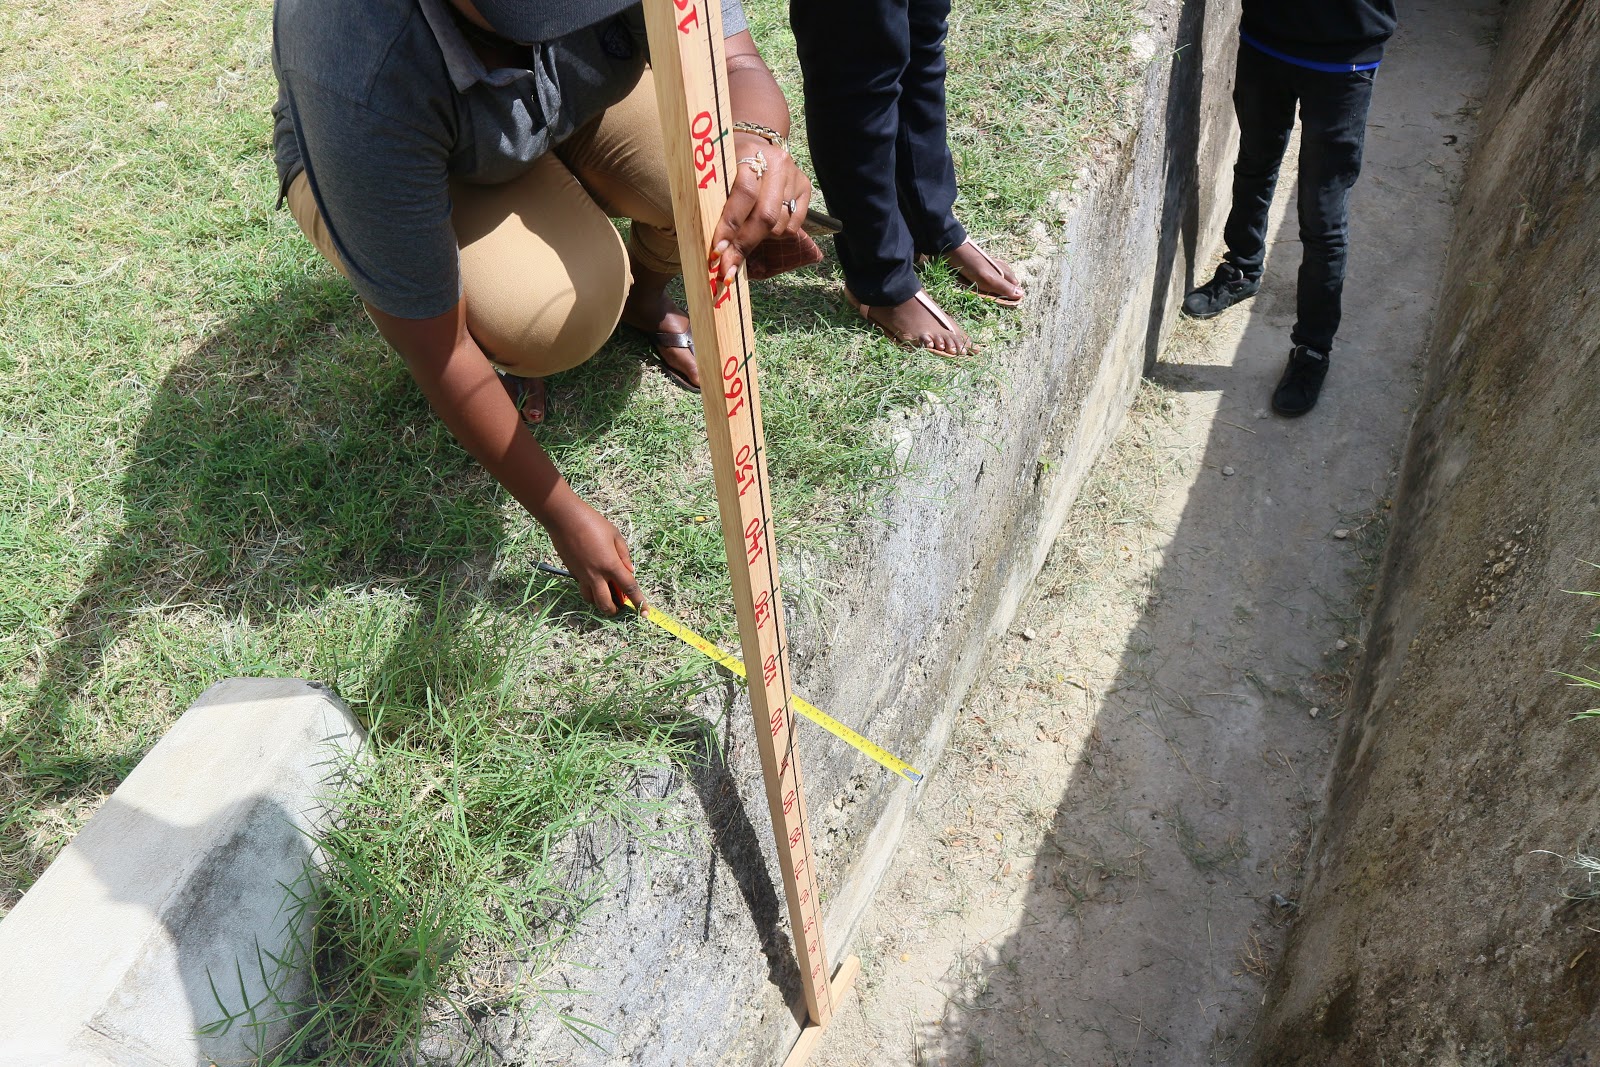
In order to accurately acquire measurements of the different details of the drains, ditches or culverts, tools fit for this purpose were sought. These include tools like tape measures and custom-made measuring sticks (designed by our own Tanzanian team!) to measure depth and width of drains and diameter of culverts. Drainage data needs to be measured accurately since the goal of Ramani Huria is to improve the city’s flood resilience, and drainage is plays a critical role in this.
Students measuring depth of the drain using custom-made measuring stick
As a test of the students’ understanding of this mapping process we took them to Hananasif ward for real field data collection. Students divided themselves into groups according to the sub-wards and then scattered to collect data. The process was a bit challenging since it was the first time for these students to collect drainage data in the actual field and some community members viewed the process as a political move, but students were very keen to explain the aim of the Ramani Huria project to any inquisitive parties.
Another challenge that came up surrounded the direction of water flow in the drains. Sometimes it is very difficult to see which way a drain flows. This problem was solved by asking community members about the direction of flow of a specific drain or by looking carefully at the sediment record.
There were also some accuracy challenges with smartphone GPS systems. Some of these issues were solved by visiting local computer programmer, Ka-Ping Yee, but certain locations remain problematic as they they struggle to allow for accurate GPS reception on a mobile phone.
Very occasionally, students encountered resistance from community members who were not well informed about the project. This particular issue justifies why Ramani Huria has such a strong emphasis on community engagement.
Students in the field at Hananasif Ward.
Despite these few difficulties, students collected as much information as they could. Their reports shows that there exist a lot of unconnected drains, drain segments filled with garbage, and streets with no drainage at all – perhaps the main cause of disastrous flooding.
The data collected from these areas is analysed for accuracy and worth using QGIS. While visualizing data through QGIS software some errors were found such as missing data and inaccurate information. In theses cases, students had to re-collect the data. As the process evolves, they are becoming increasingly aware of the importance of quality checking their information during data collection.
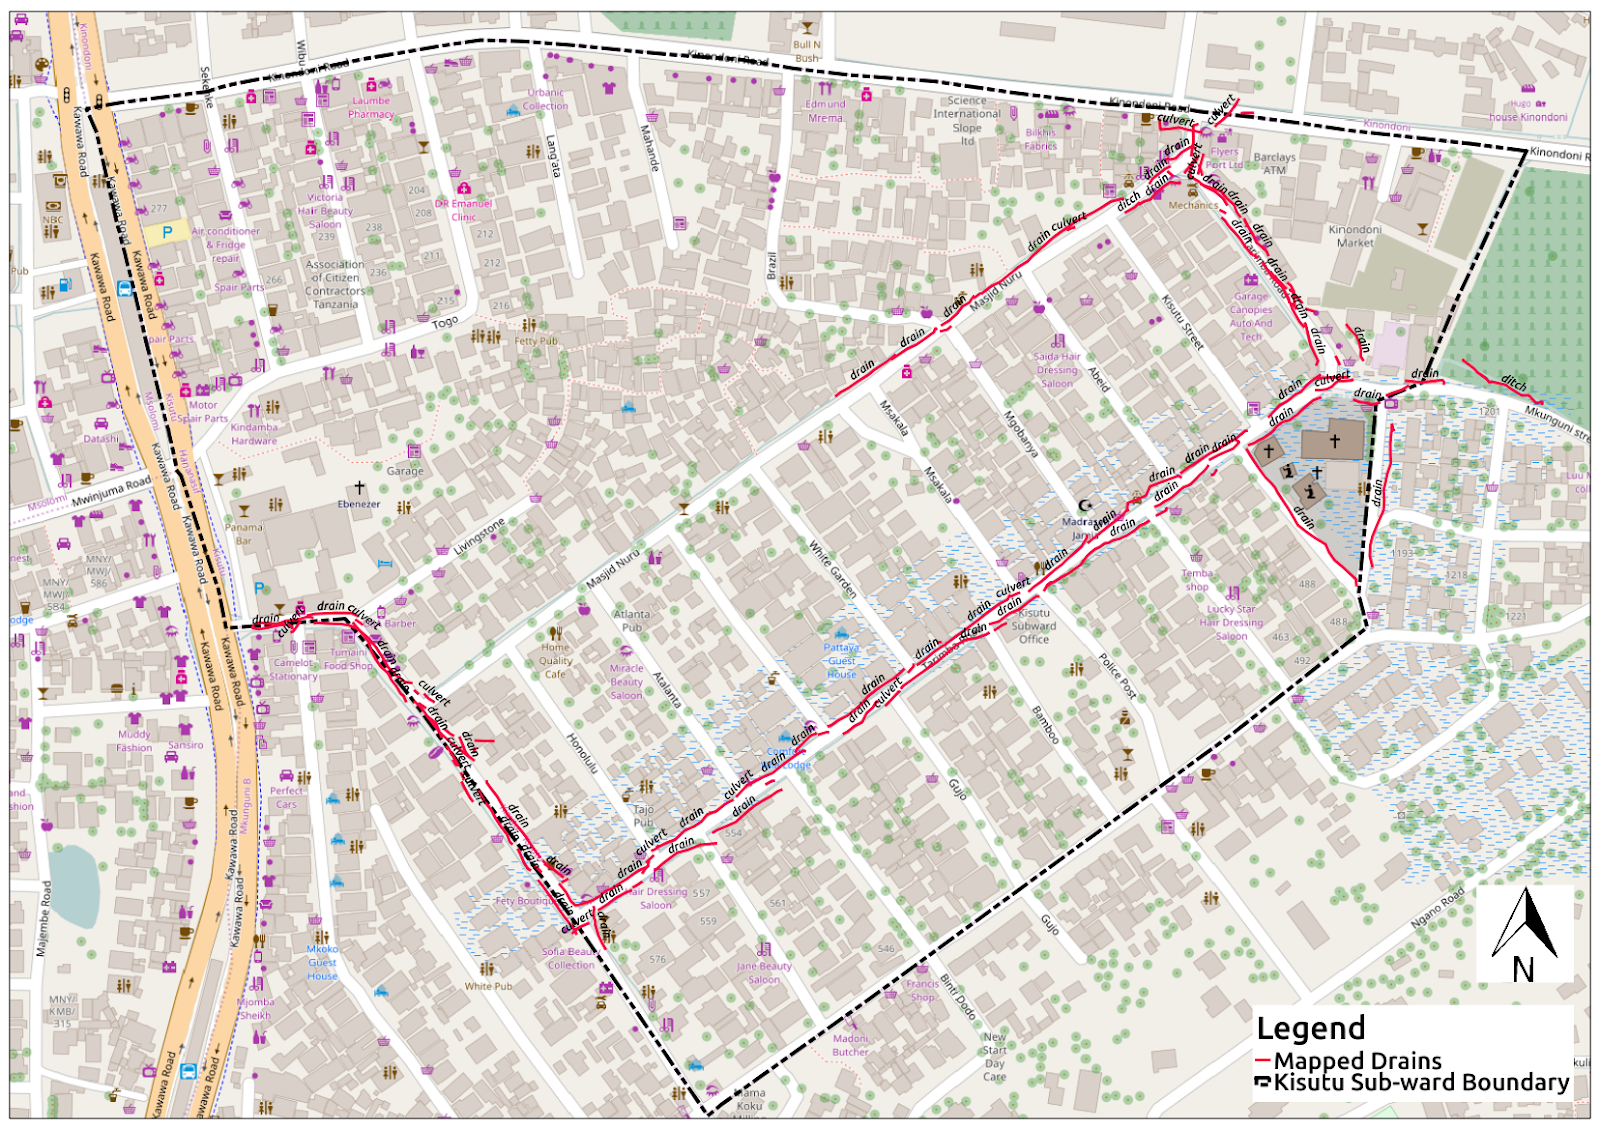
Drainage data of Kisutu Sub-ward in hananasif visualized on QGIS
Our students are will continue with their training and practice to make sure they are well equipped with the necessary skills required to undertake the official mapping process.
Scaling up a field mapping project within a city of over 5 million people requires proper planning and training. We first wanted to give our field mappers a thorough overview of how data is inputted into OSM to ensure a clear understanding of the OSM ecosystem and how it works. At a later stage, we will be showing them how OSM data can be used for several different purposes.
Teaching 300 new mappers how to map, however, comes with certain challenges. All of our mappers have been beginners, and most of them have never contributed to OSM before. Their first task was therefore a simple one – to create OSM accounts, signing up to join the global community of contributors. We then introduced them to the platform and showed them how to make edits.
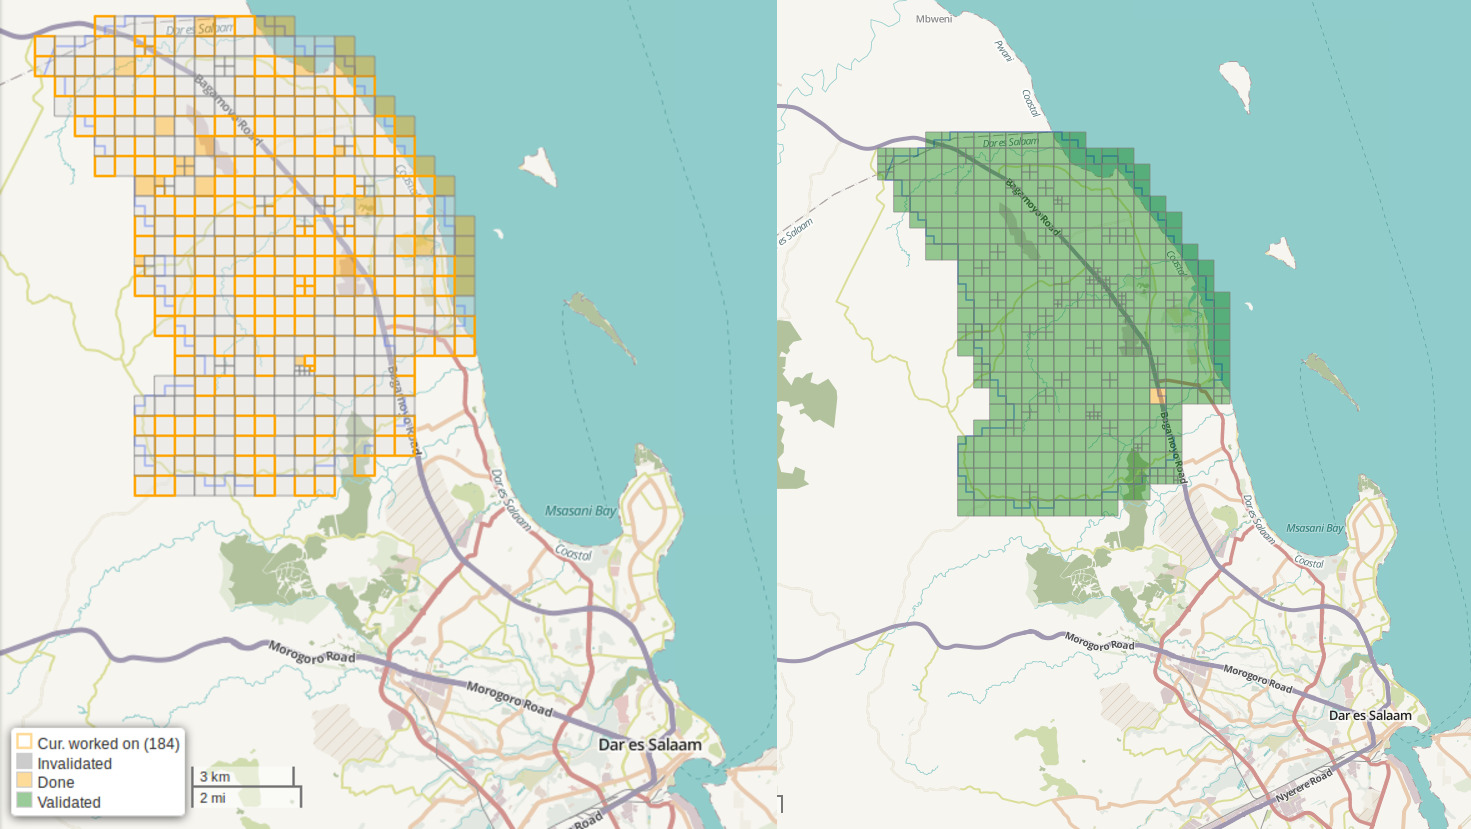
One of the goals of Ramani Huria 2.0 is to map the entire city of Dar es Salaam in OSM. We began by dividing our mappers into four teams and distributing mapping tasks. Within hours, the relatively small tasks were mapped to 100% and mappers had been effectively introduced to mapping and had successfully contributed to OSM..
We anticipated the beginner level of our mappers would cause some issues, and indeed it did – data quality.
That very evening, we got a message from one of the experienced mappers in the OSM community highlighting some of the errors they had come across, which had been made by our mappers. This is the power of the OSM community. Earlier on in the training, a question had been asked of the authenticity of OSM data and how errors are addressed and controlled. Here was their answer. The community is always looking.
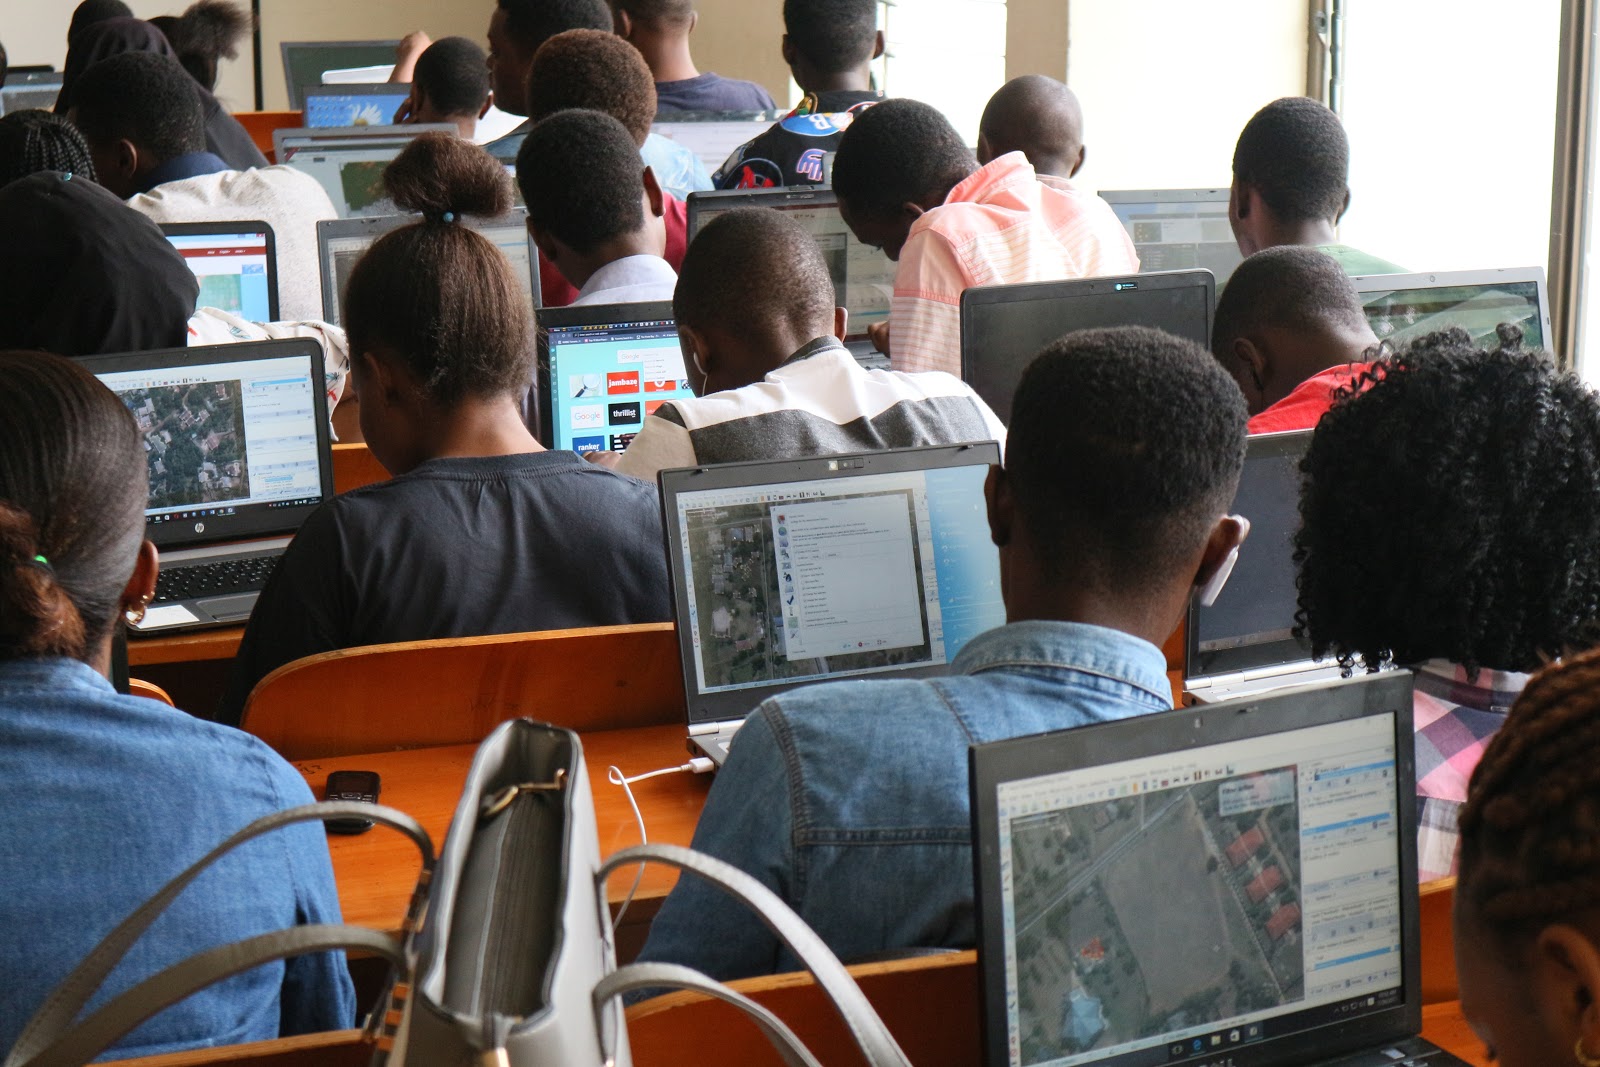
Student mappers mapping with JOSM
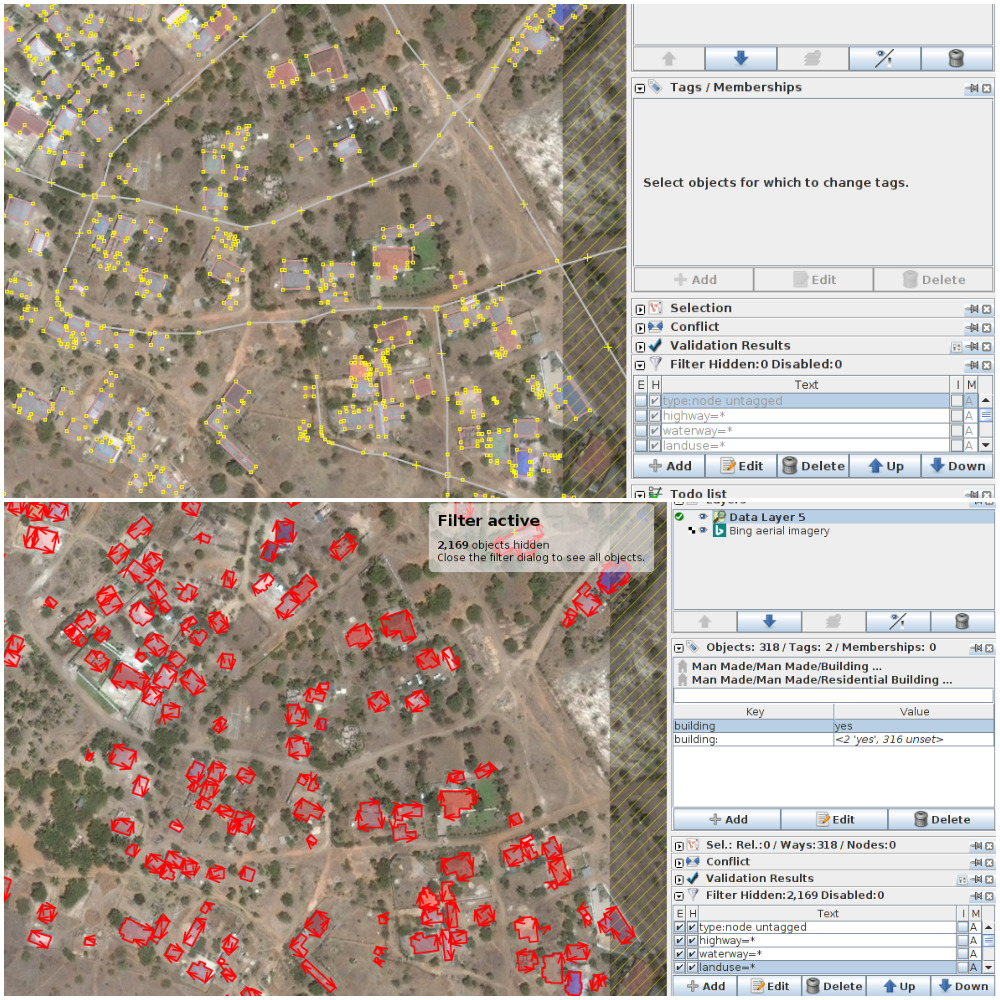
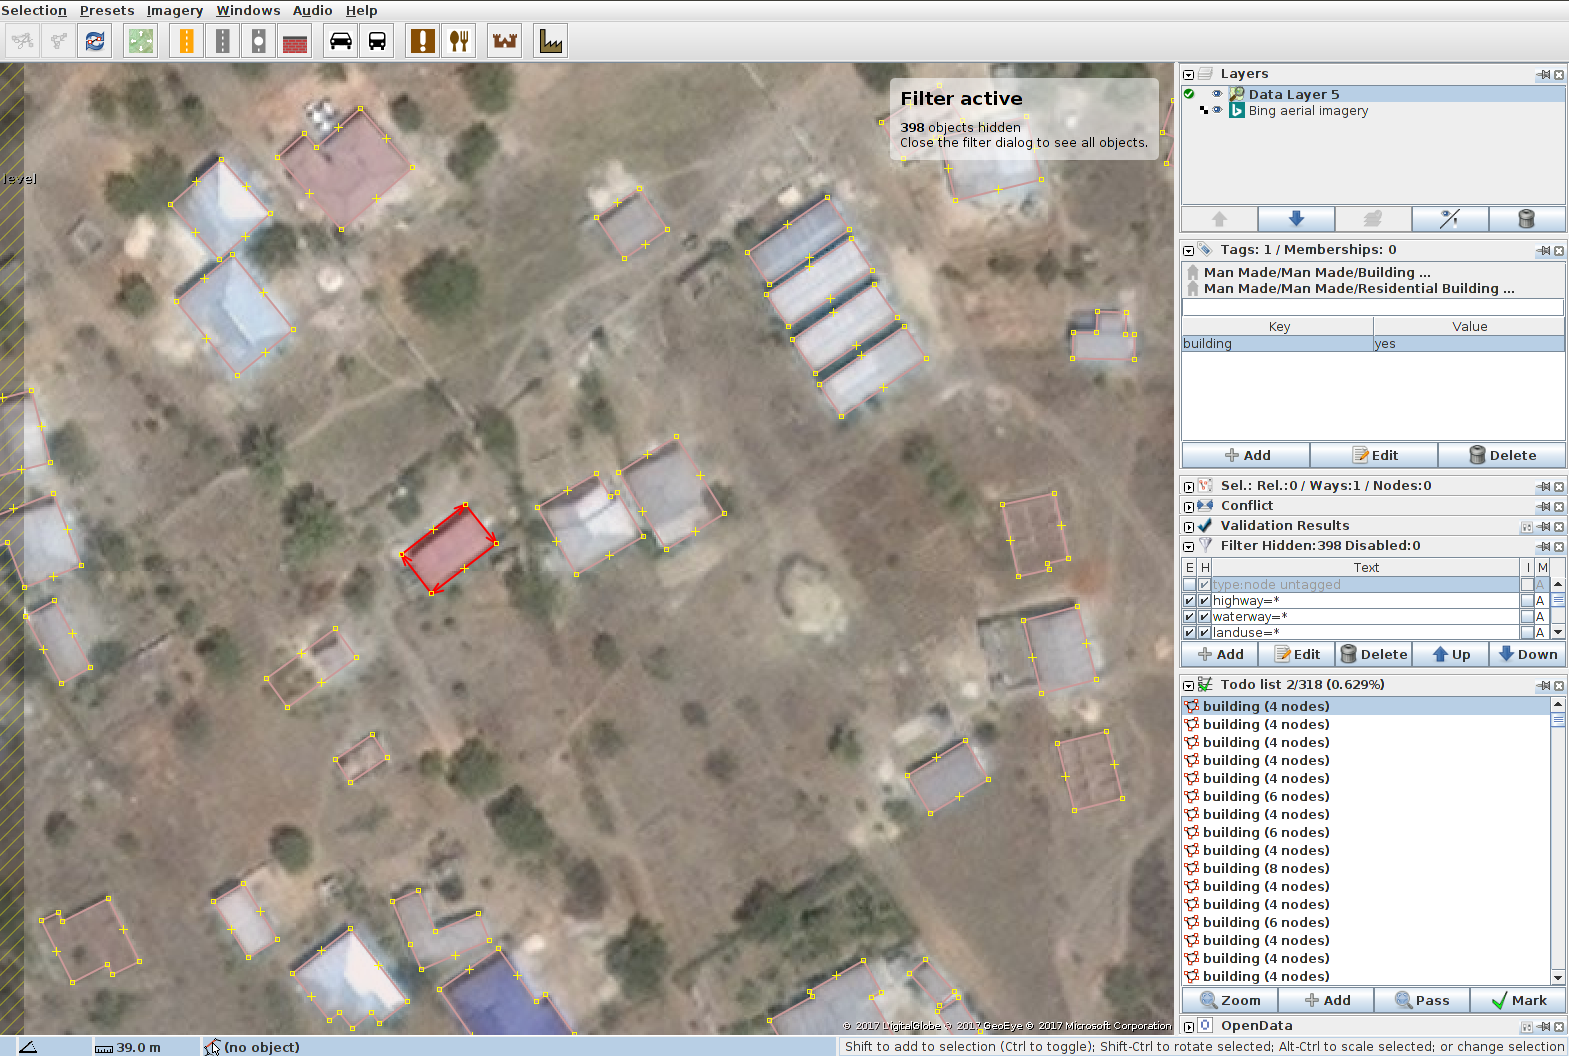
Next on our agenda was to address these data quality issues, a vital step in successfully contributing to OSM. Major issues identified were tag spelling mistakes, untagged buildings and several buildings not squared or connected to each other. We wanted to introduce simple methods for addressing these while also using the same opportunity to exhibit the value of more tools in JOSM.
JOSM filters came in handy to solve the data quality challenges, with the guidance of plugins like the Todo list. It was a combination of these that brought us closer to completely eliminating the problem. The teams validated the tasks, which reduced and cleaned up some of these errors, but several were still unsolved.
A new task was subsequently set up, intended to be a validation task for the data that had been created earlier on.
New task created
The steps for this are as follows:
Select the task to validate and open it in JOSM.
Use Bing Aerial Imagery to validate, unless there is cloud cover, then use Mapbox imagery or DigitalGlobe Premium.
Check that all buildings are mapped in the task being validated, if there are unmapped buildings, map and tag them correctly, with the tag building=yes.
Use filters to filter out all highways, land use, and waterways. Add these filters to JOSM.
type:node untagged (to hide all way nodes that are not tagged).
highway=* (to hide all highways).
waterway=* (to hide all waterways).
landuse=* (to hide land use type features).
Using filters
Use the Todo list plugin to check attributes of all buildings one by one.
Attributes to check are:
building=yes
Common tagging errors encountered were:
buildin=yes
BUILDING=yes
Building=yes
building:=yes
builging=yes
bulding=yes
biuilding=yes
bubuilding:=yes
buildind=yes
builing=yes
Buildings added to the Todo list to be checked
Once all buildings have been checked (shapes and tags), Run Validation in the Validation Results window, look up all the warnings and fix them.
upload to OSM.
These steps solved the issues to a great extent. However, there were some of errors that remained even after checking the tasks again. The problem now was not related to workflow, but to experience. Our mappers need more time practicing and mapping to effectively outgrow some of these errors.
We are also considering whether a spell-checker could be a useful feature for JOSM! A lot of mappers, particularly new ones, perform a relatively limited set of operations, such as adding buildings; they rarely need tags outside of the “core” set of common OSM tags. Perhaps JOSM could alert a mapper when a tag is not within that small set (possibly due to misspelling)? Anyone out there in the coding community want to take a look?


![Screenshot_2017-11-01-11-46-14[1].png](https://lh6.googleusercontent.com/ezhOeBBhdEwb7SgM_Okr5glUaZqGuq4N2tSwxDOhJVQr8BZZw84HS3Lo_DQIDhBBkGpoEsEAZ8aw_GfvSrn7qdoIJaF8u6brTevOw_jyRnbojUJzOwJVvtsAuAK9WPOMylSxJkgV)

![Screenshot_2017-11-01-12-20-46[1].png](https://lh5.googleusercontent.com/6tFPRP0EEd05m1w4vtDJTPQ-yUGz96k5sdEjZYiBYJp2j5ye2ec2uwDVF0iyw8epc_FC8LVdg6Fq80c2ZqosGoHhfSagQi9TRJx7NzfR0ZQmD2zB0DJwXejeXKn7HYk_3AGlewyK)