Categories
Mapping

Students Complete Industrial Training – 228 Mapped Subwards and Action Maps for Disaster Management of Dar es Salaam

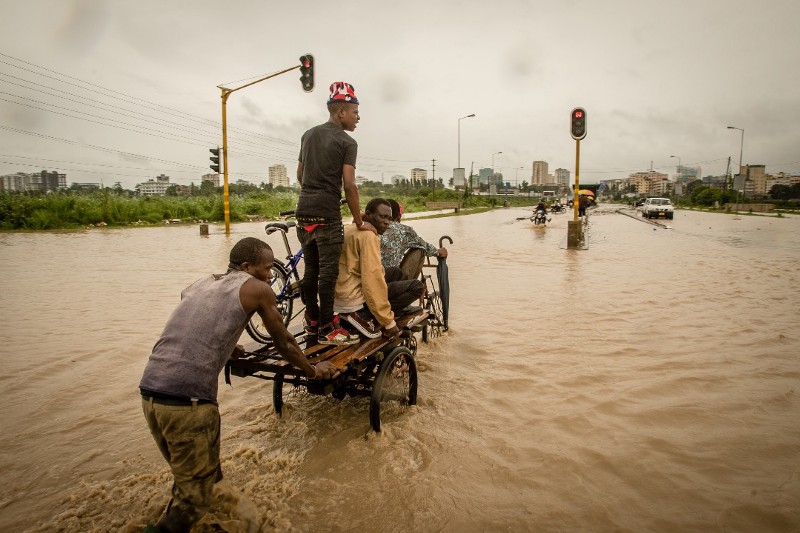
2018 has been a year for floods. In March, excessive rains in East Africa killed nearly 500 people. In July, Japan saw heavy downpours which led to widespread devastation with more than 200 deaths. In August, another 300 people lost their lives in Kerala, India during the worst monsoon in nearly a century. And just this month, Typhoon Mangkhut has killed over a 100 in the Philippines while the east coast of the United States has witnessed unprecedented flooding as a result of Hurricane Florence.

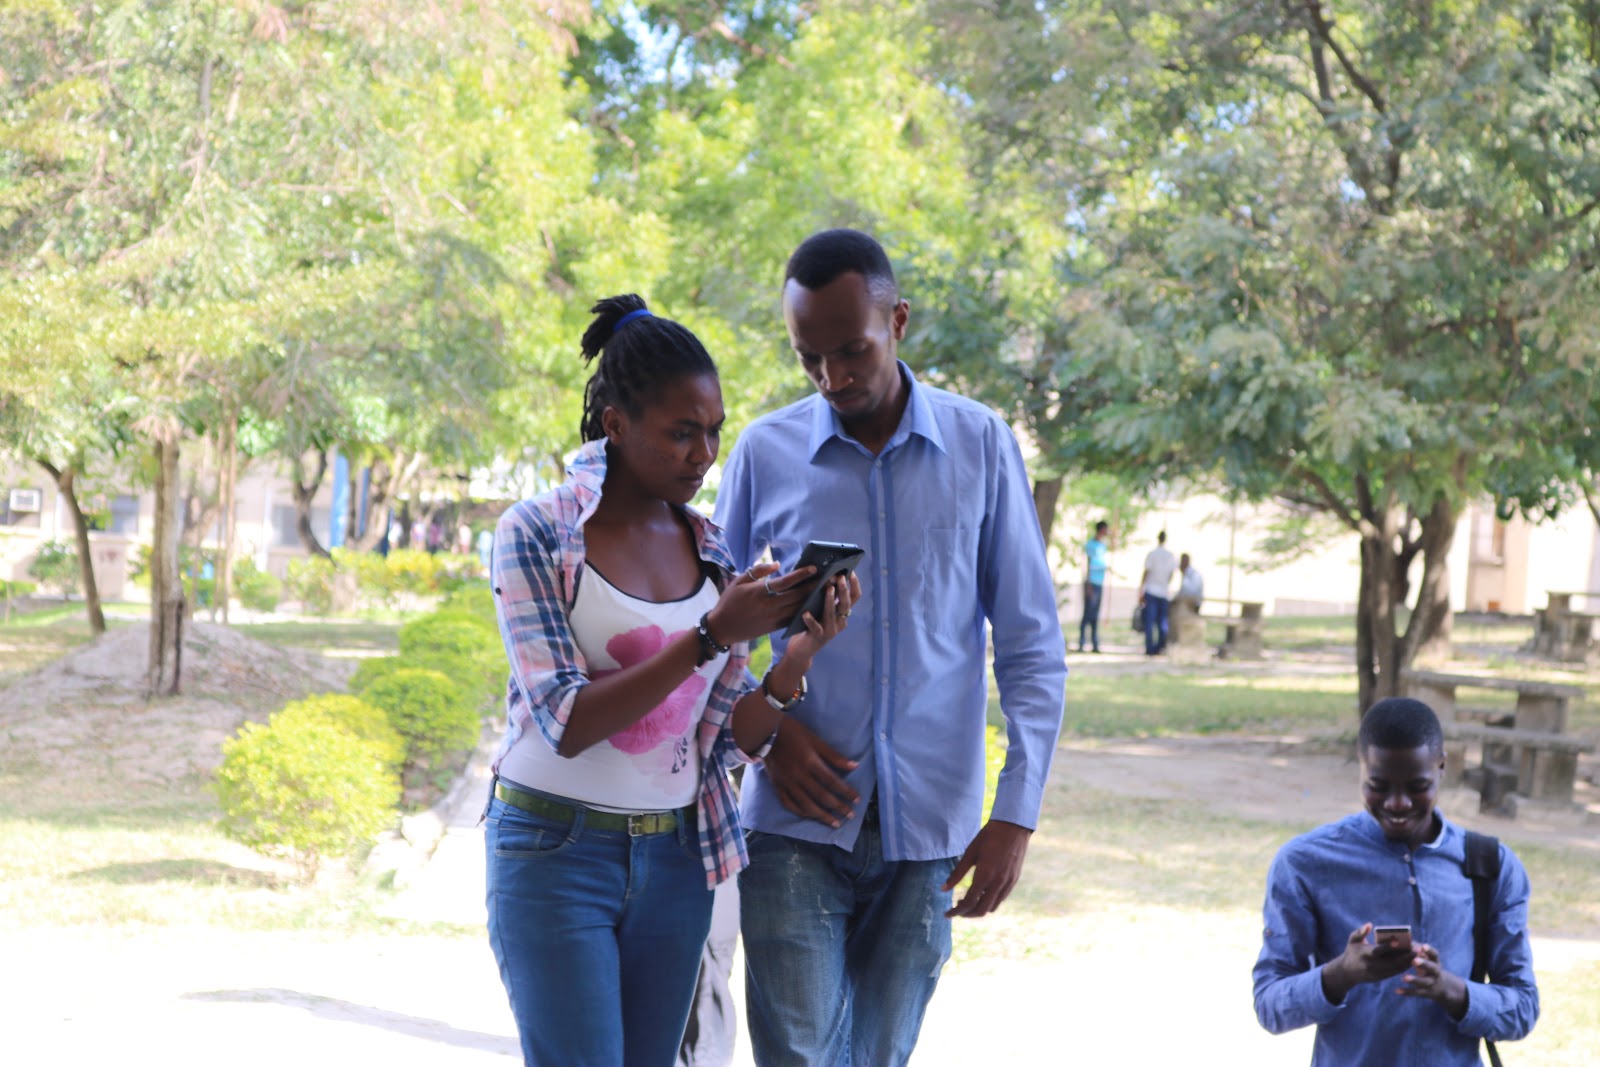
In Tanzania, students from Ardhi University and the University of Dar es Salaam have completed the mapping of 228 subwards – identifying assets and threats to strengthen the understanding of climate risk at the local level, leading to greater flood resilience. Ramani Huria would not have been able to accomplish this without scaling up the project, working with well over 450 students for the past seven weeks.

To get an idea of the preparation for this work, check out our previous post here – but to get an inside look at how we conducted this year’s industrial training read on.

Summary of Seven Weeks

TRASH MAPPING 

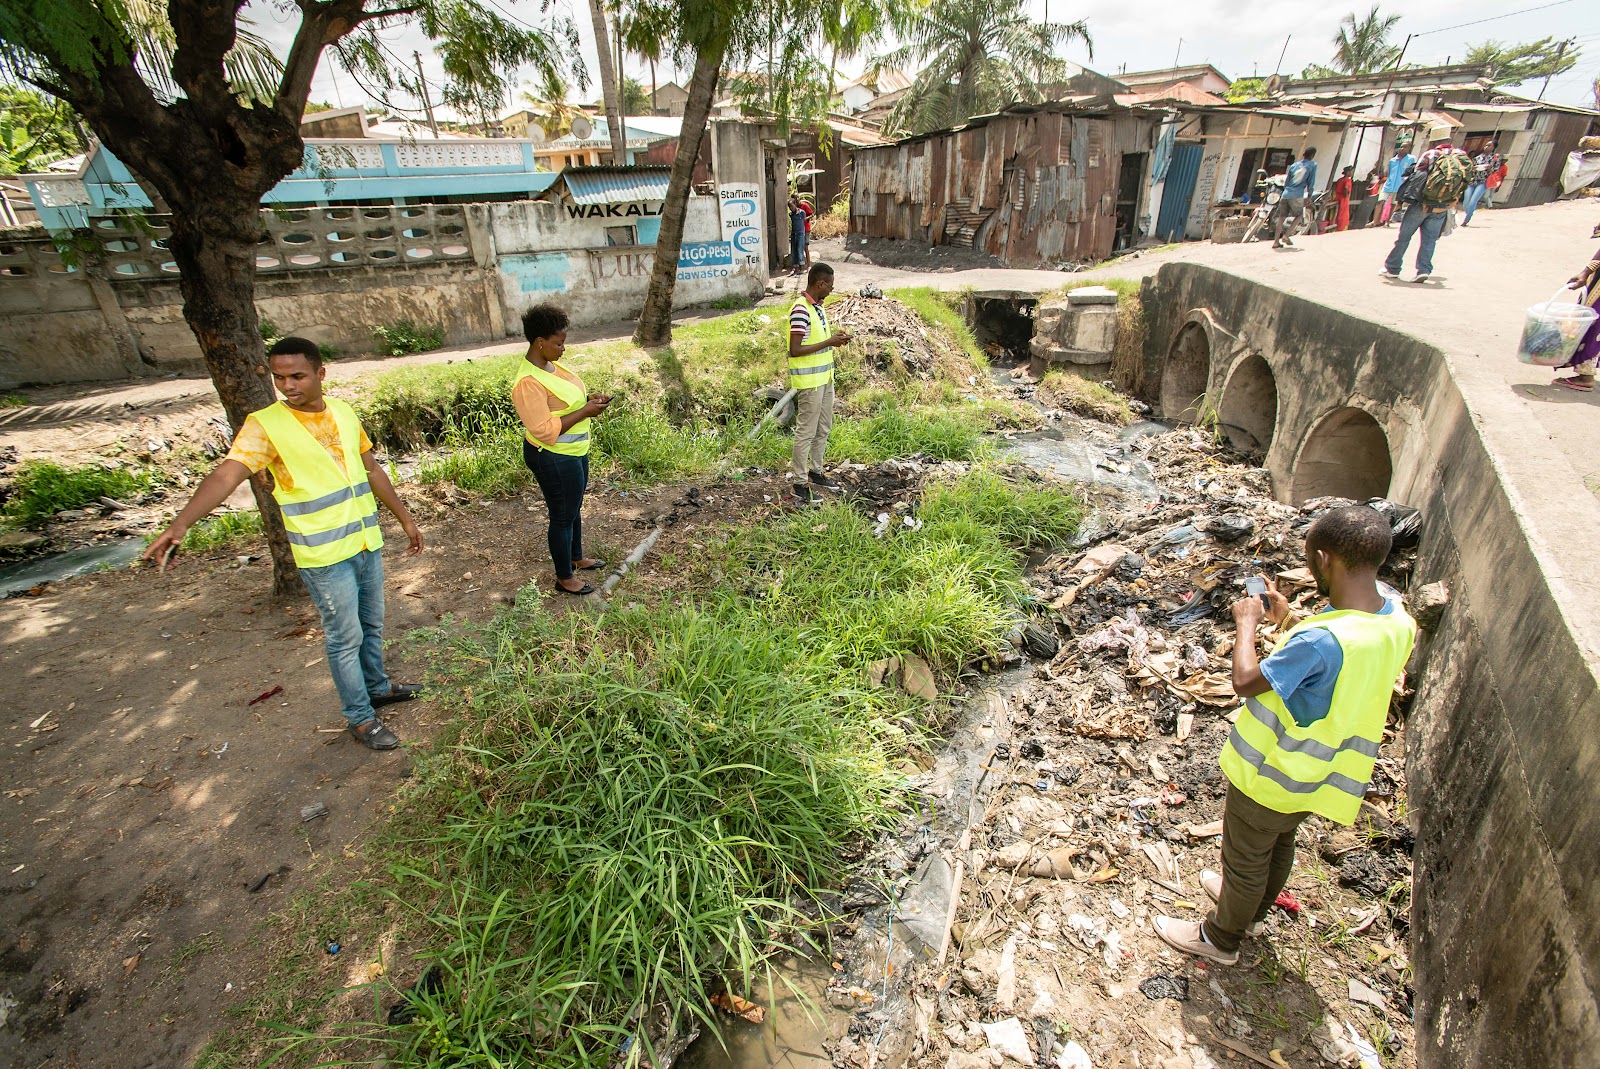
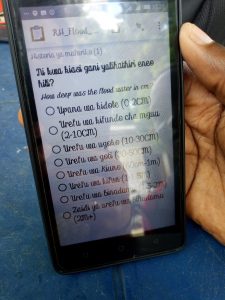
After orientation, Week 2 began with trash mapping to support a civic-led mass movement called Let’s Do It! World, whose goal is a clean and healthy planet. This was organized by their lead partner in Tanzania, Nipe Fagio, or “Give me the broom” in Swahili. The aim was to collect major trash points in Dar es Salaam. Students mapped 44 wards of the city by using OpenDataKit (ODK) – an Android application that we use to collect an enormous amount of data. In total, 20,392 trash points were mapped. It is never a good thing to have so many trash points in a city, but by mapping them in advance we are able to strategize the efforts during World Cleanup Day on 15th September. 

Students mapping trash in Buguruni Ward. Photo credit: Chris Morgan/World Bank.

COMMUNITY ENGAGEMENT TRAINING 

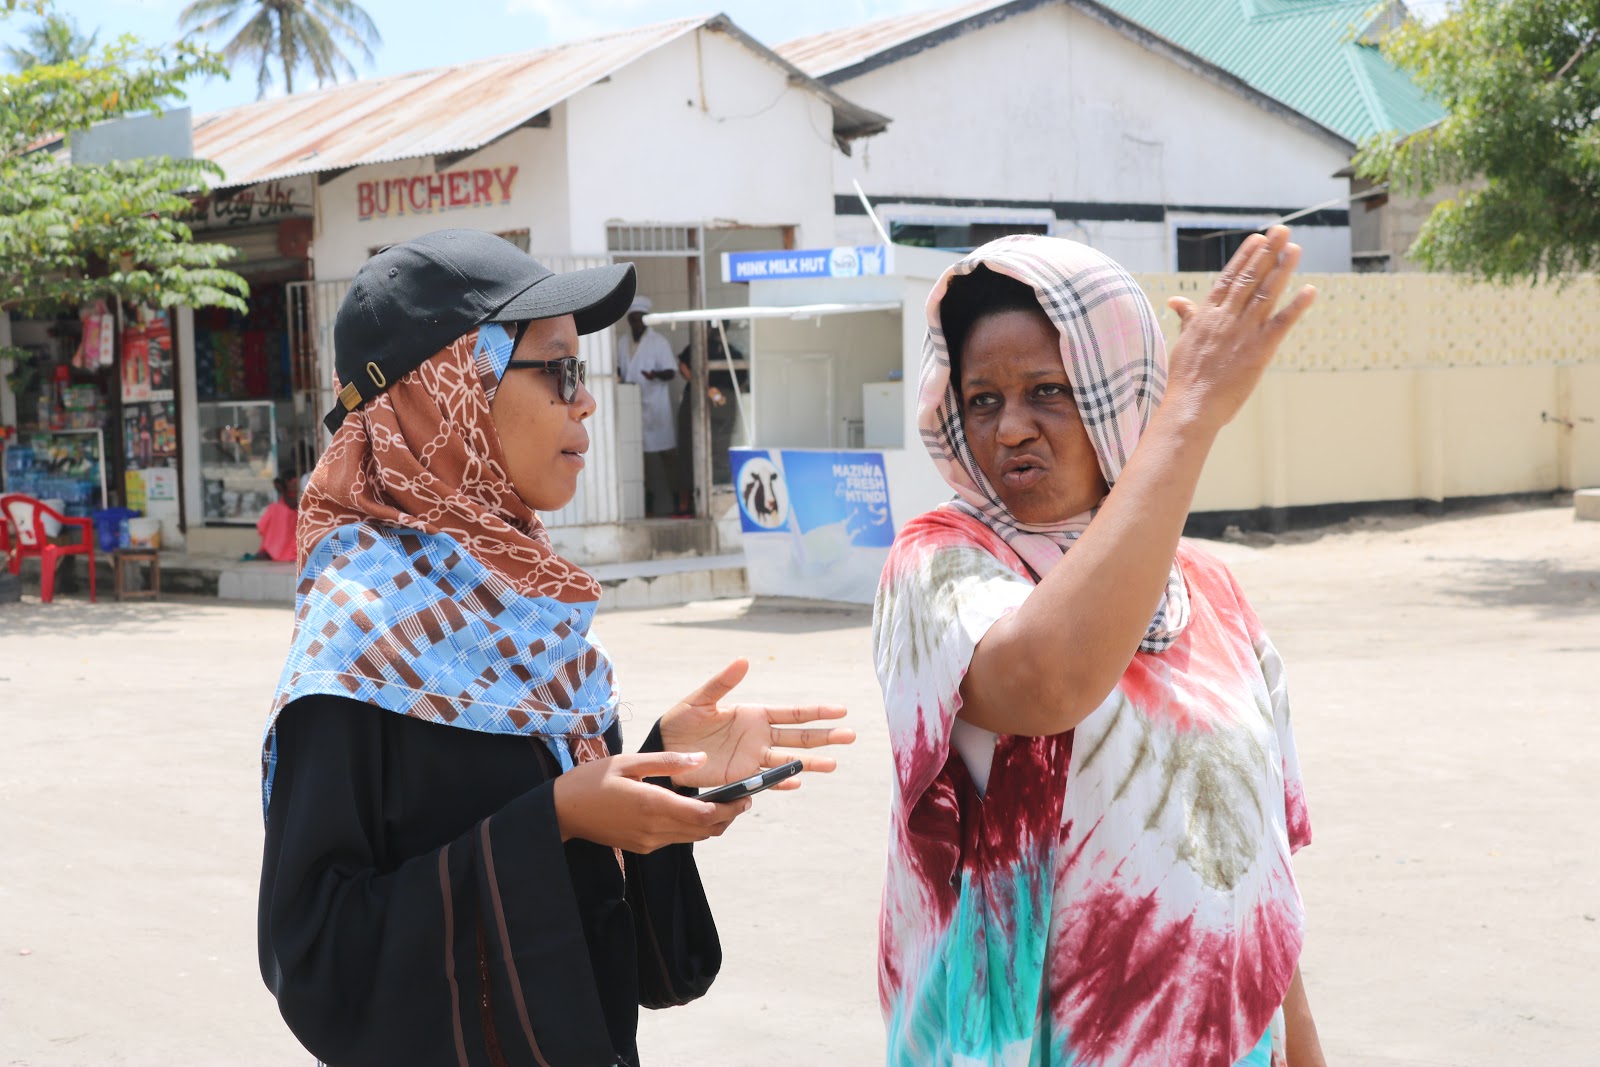
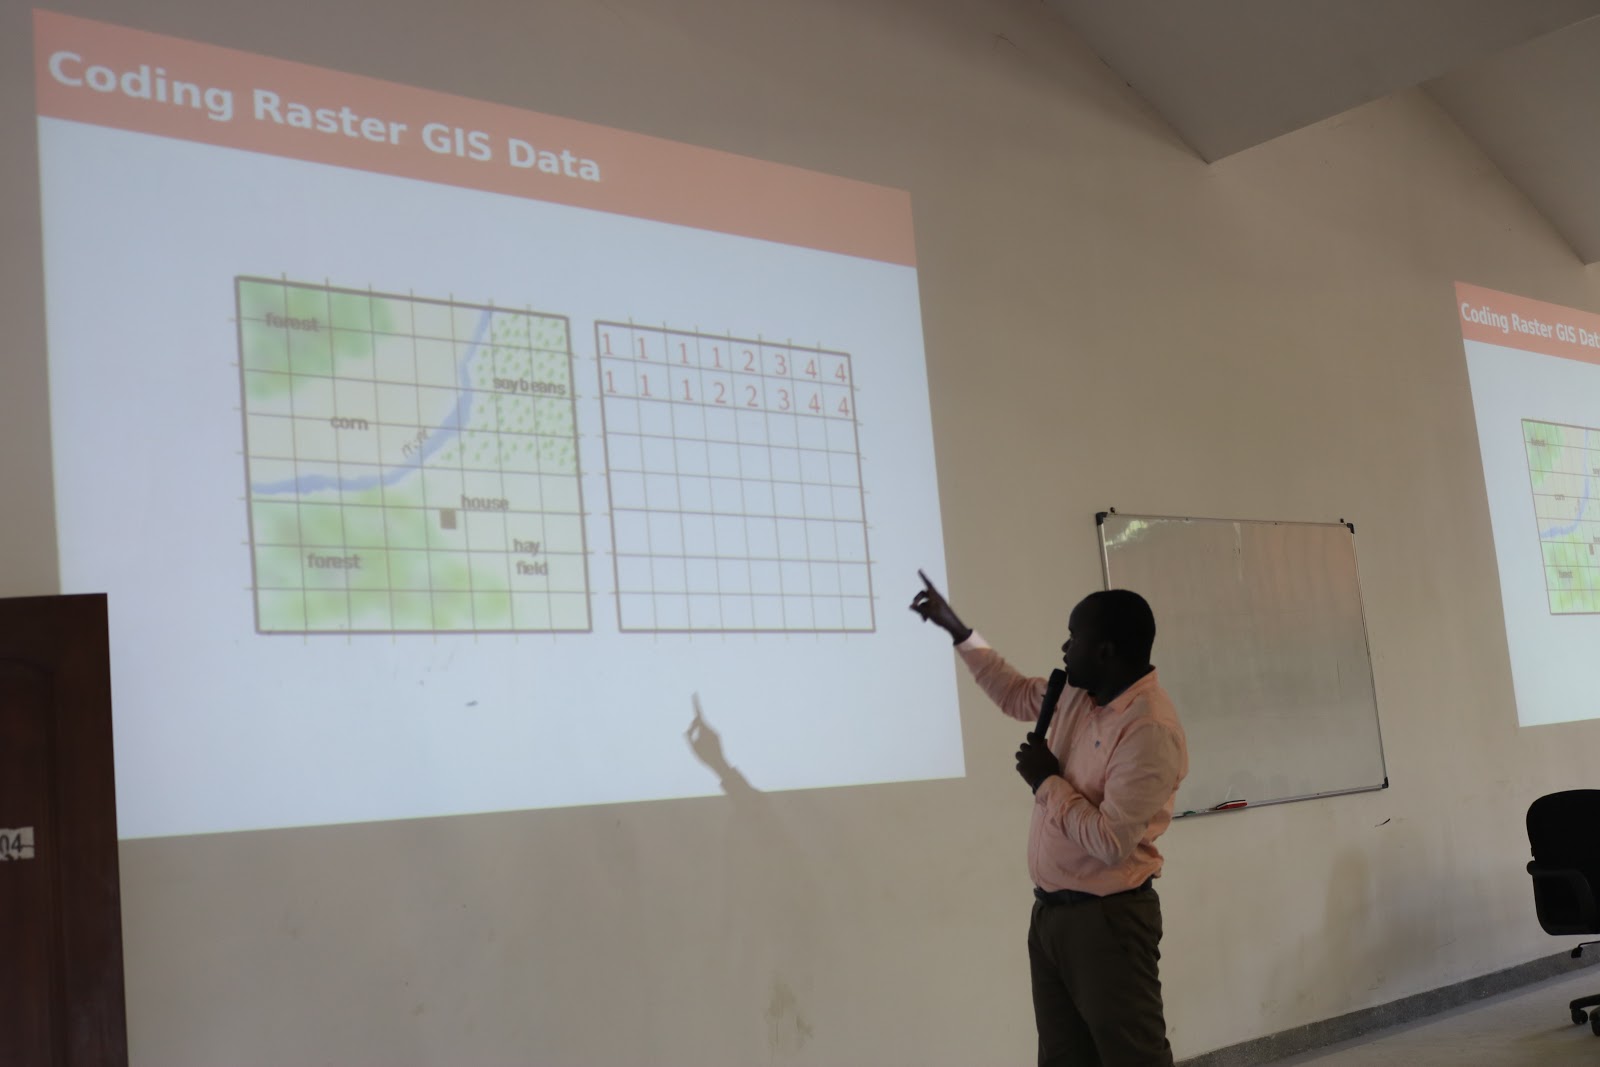
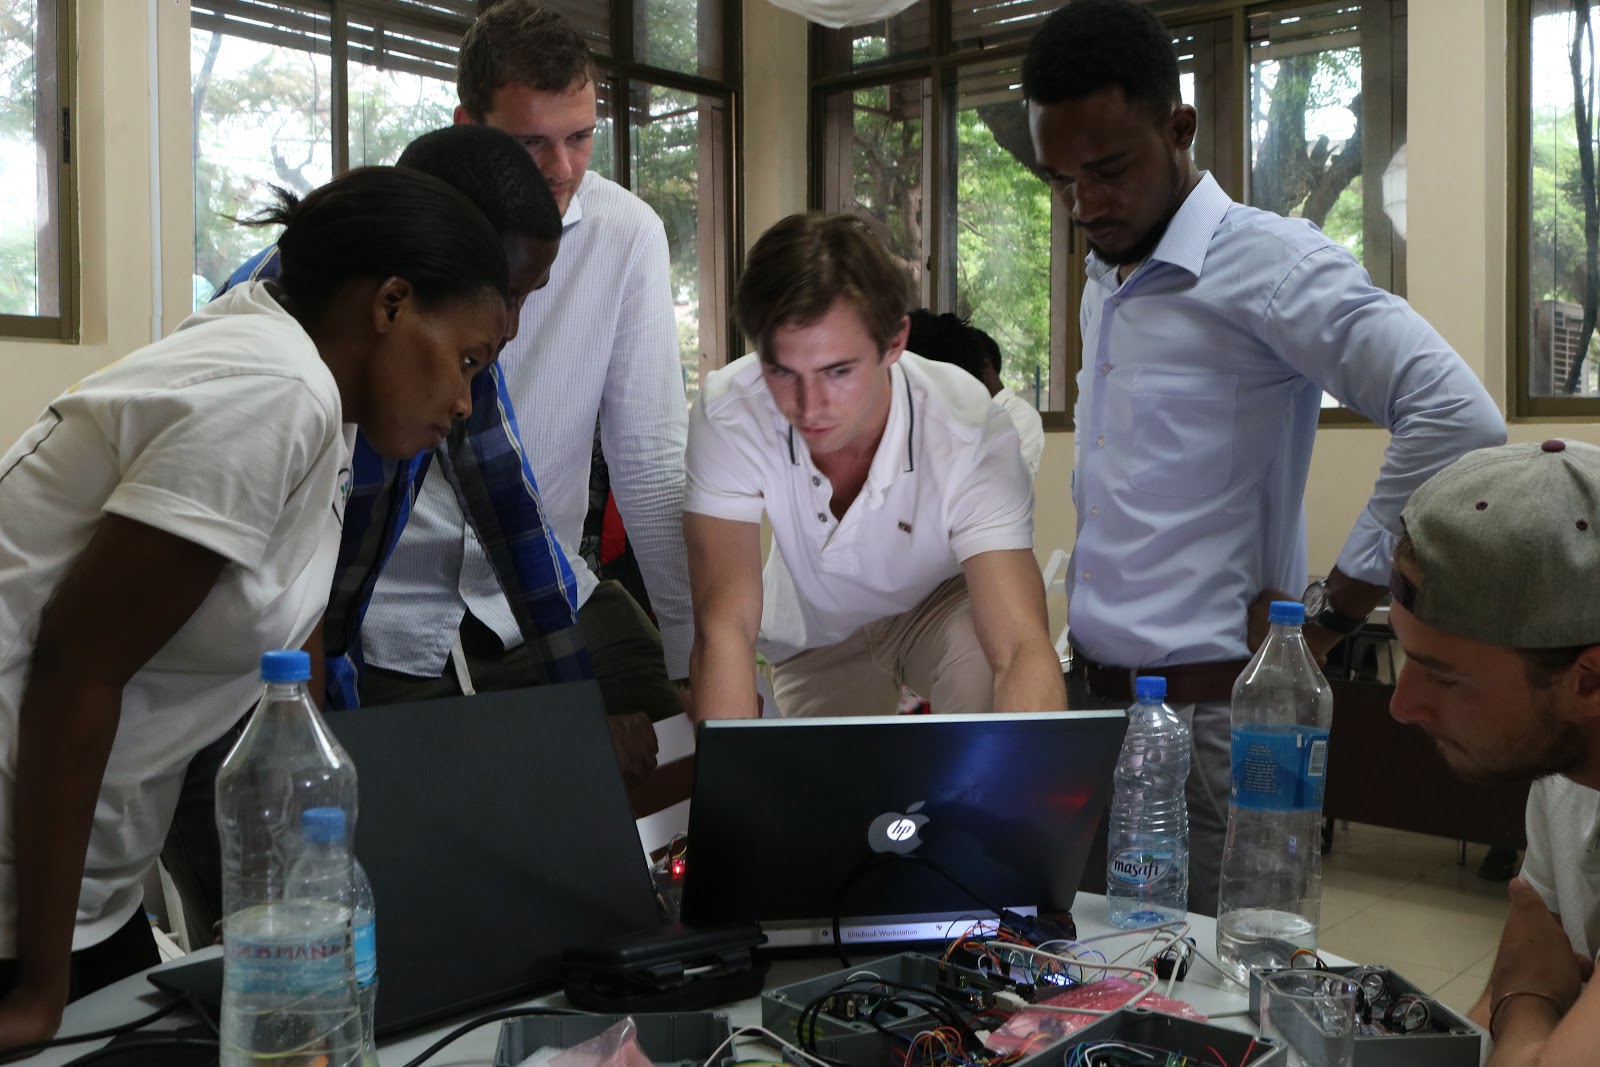
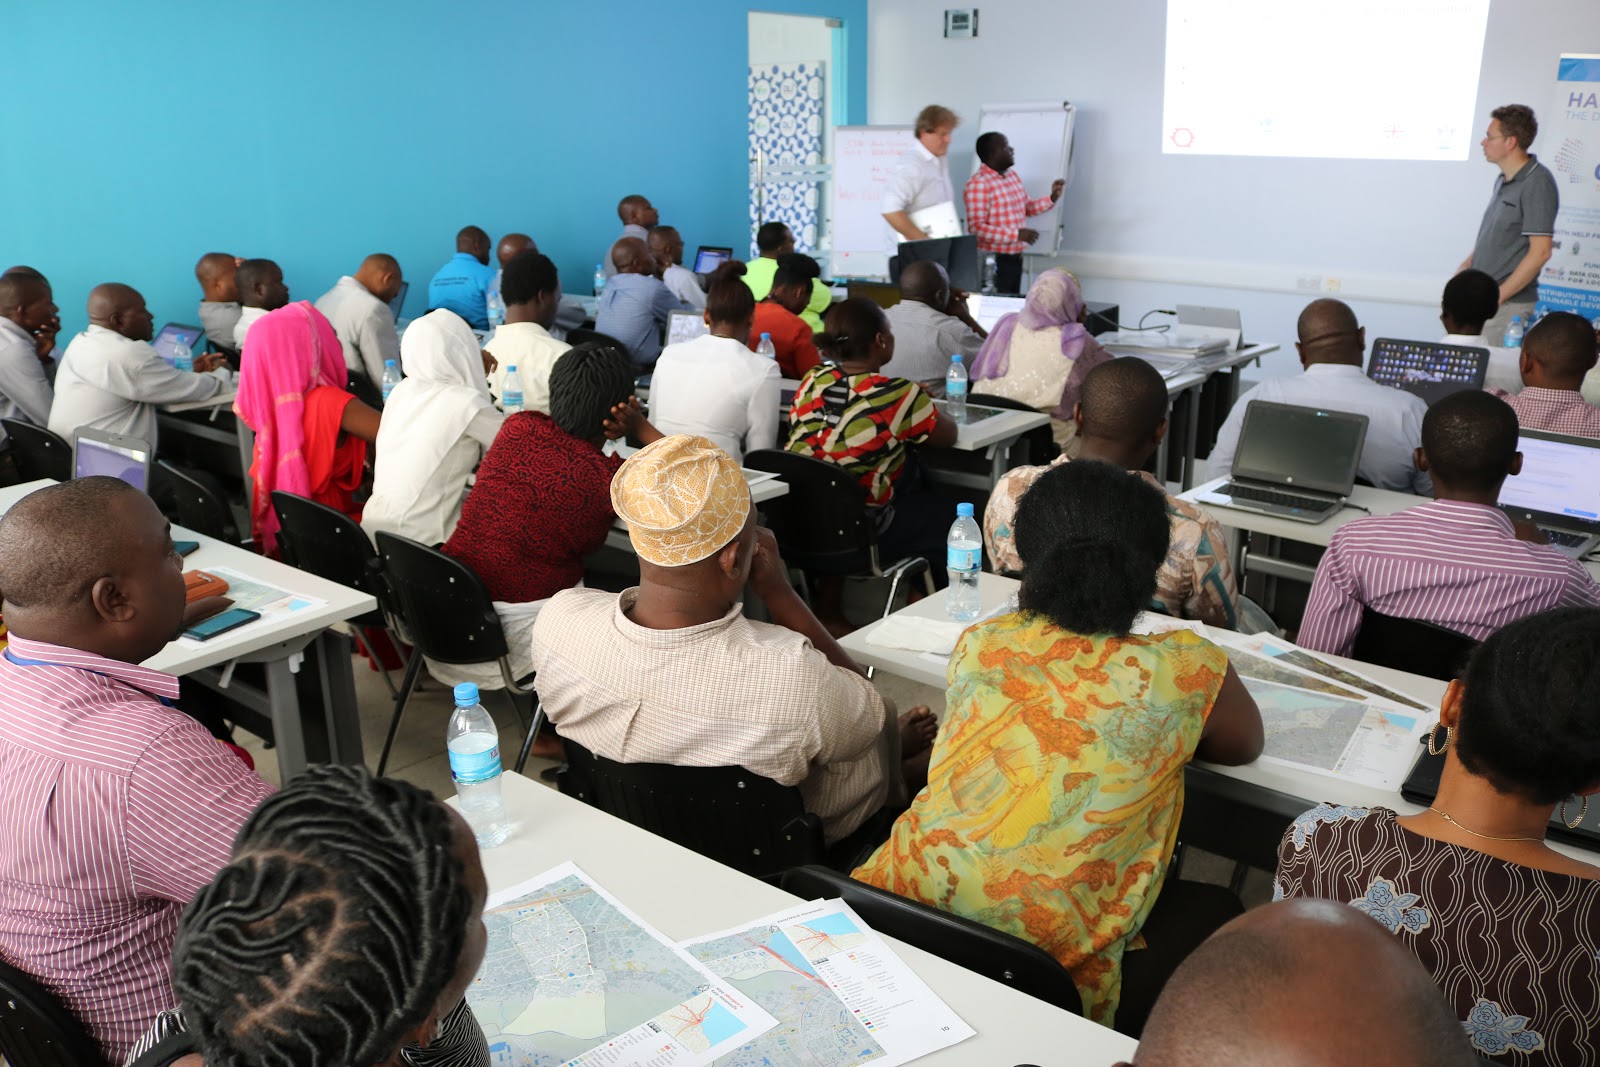
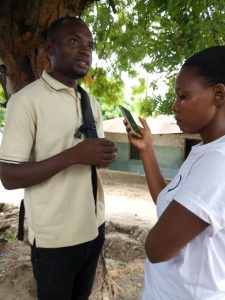
For Weeks 3-6 students engaged in the main part of this summer’s training: Community Asset and Threat Mapping. First, they received training on how to conduct meetings with community members and collecting data with their help. Then, students were trained on how to handle challenges and problems that may occur during their field operations, for instance, when political issues arise. What follows is the methodology that Ramani Huria used to conduct our data collection.

Methodology in Brief

Community meetings were held differently based on whether the subward was mapped or unmapped. There were 26 wards in Dar es Salaam that were mapped in detail during RH 1 in 2015, and 18 wards that were unmapped.

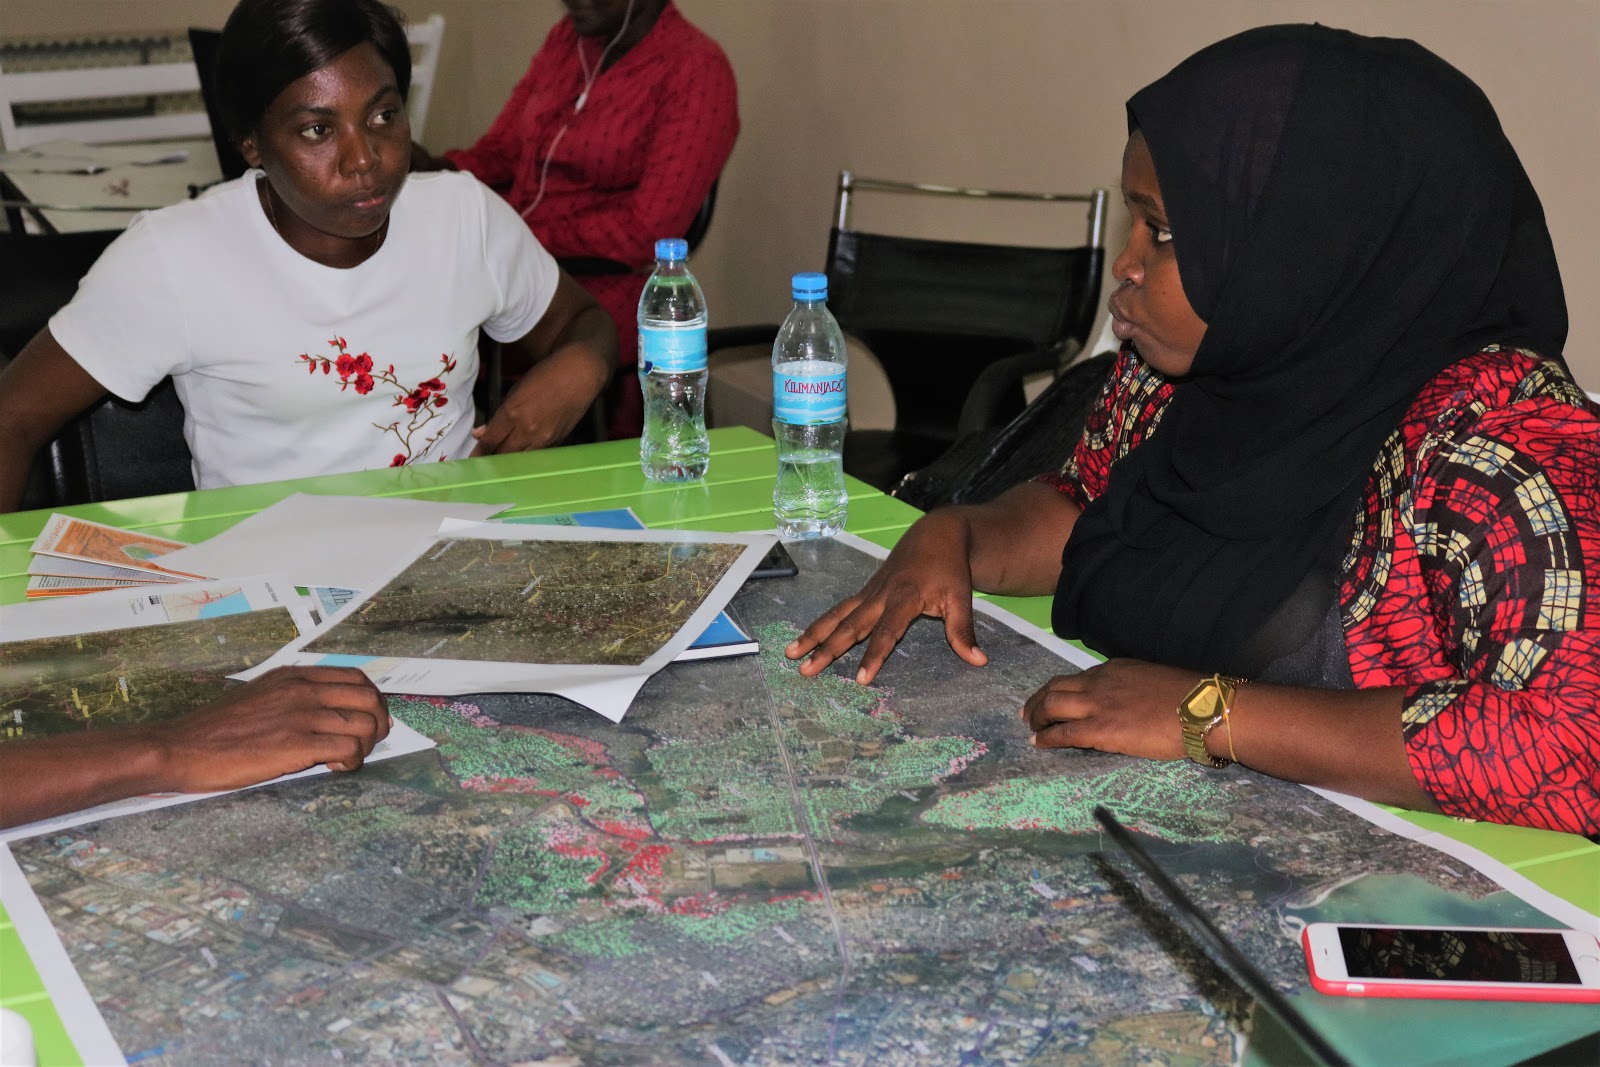
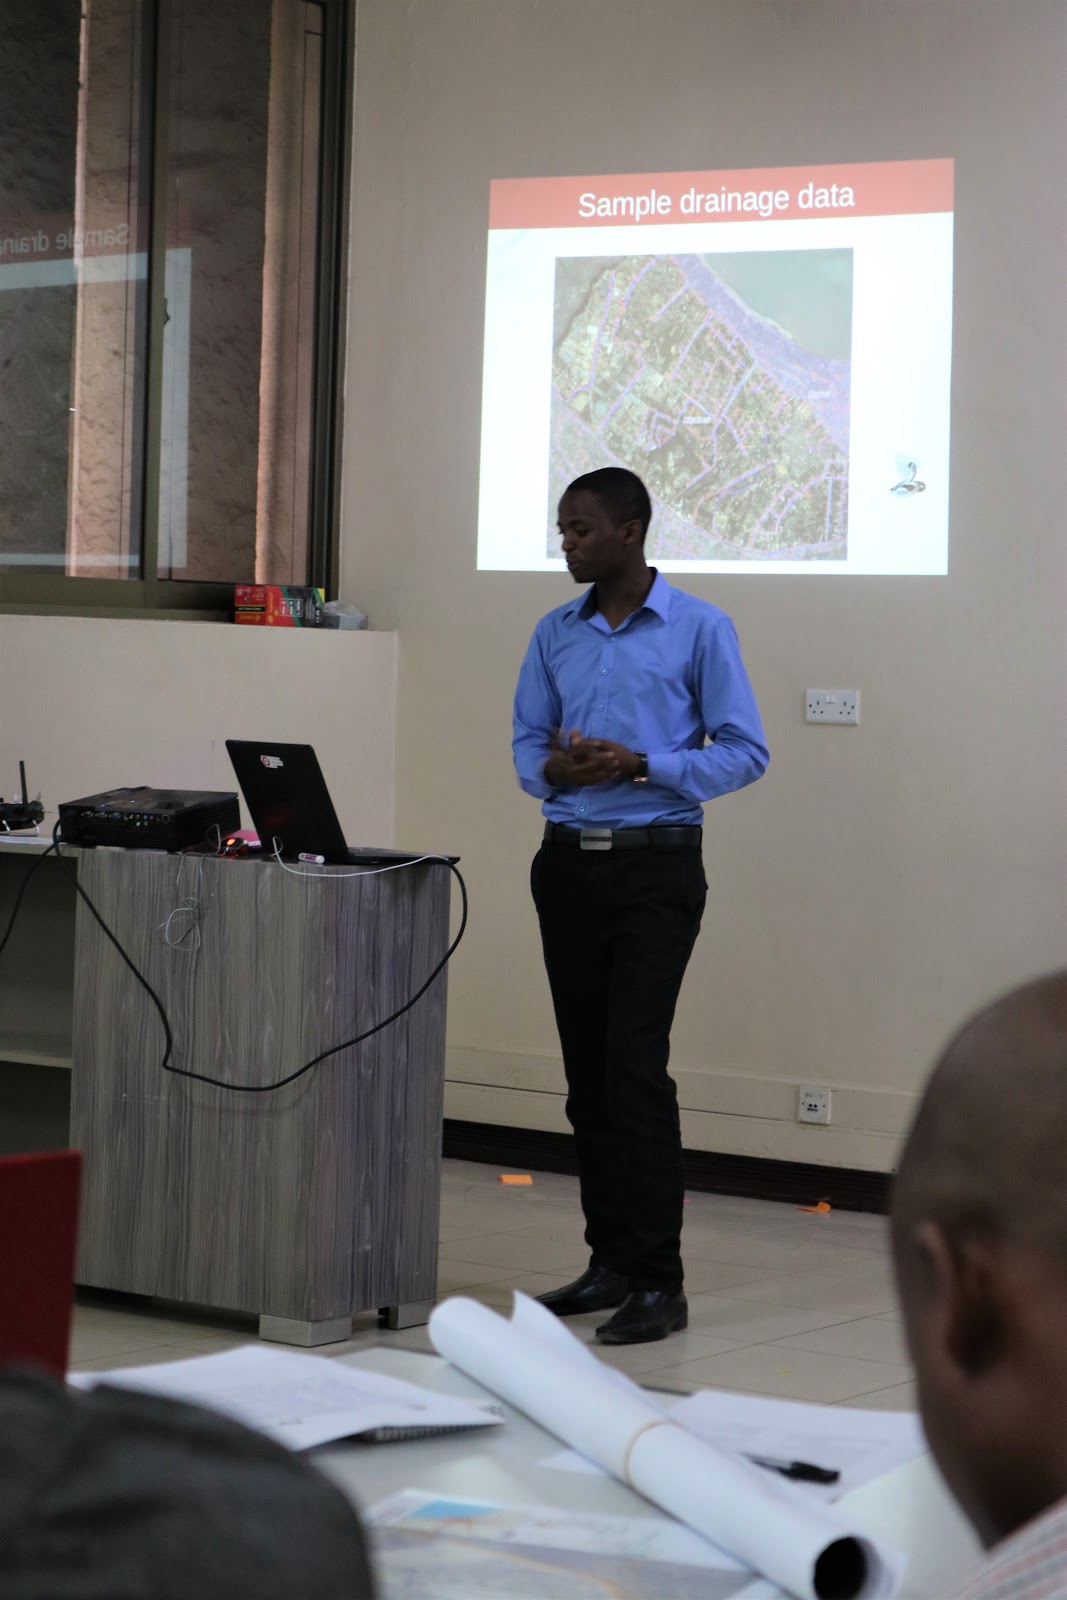
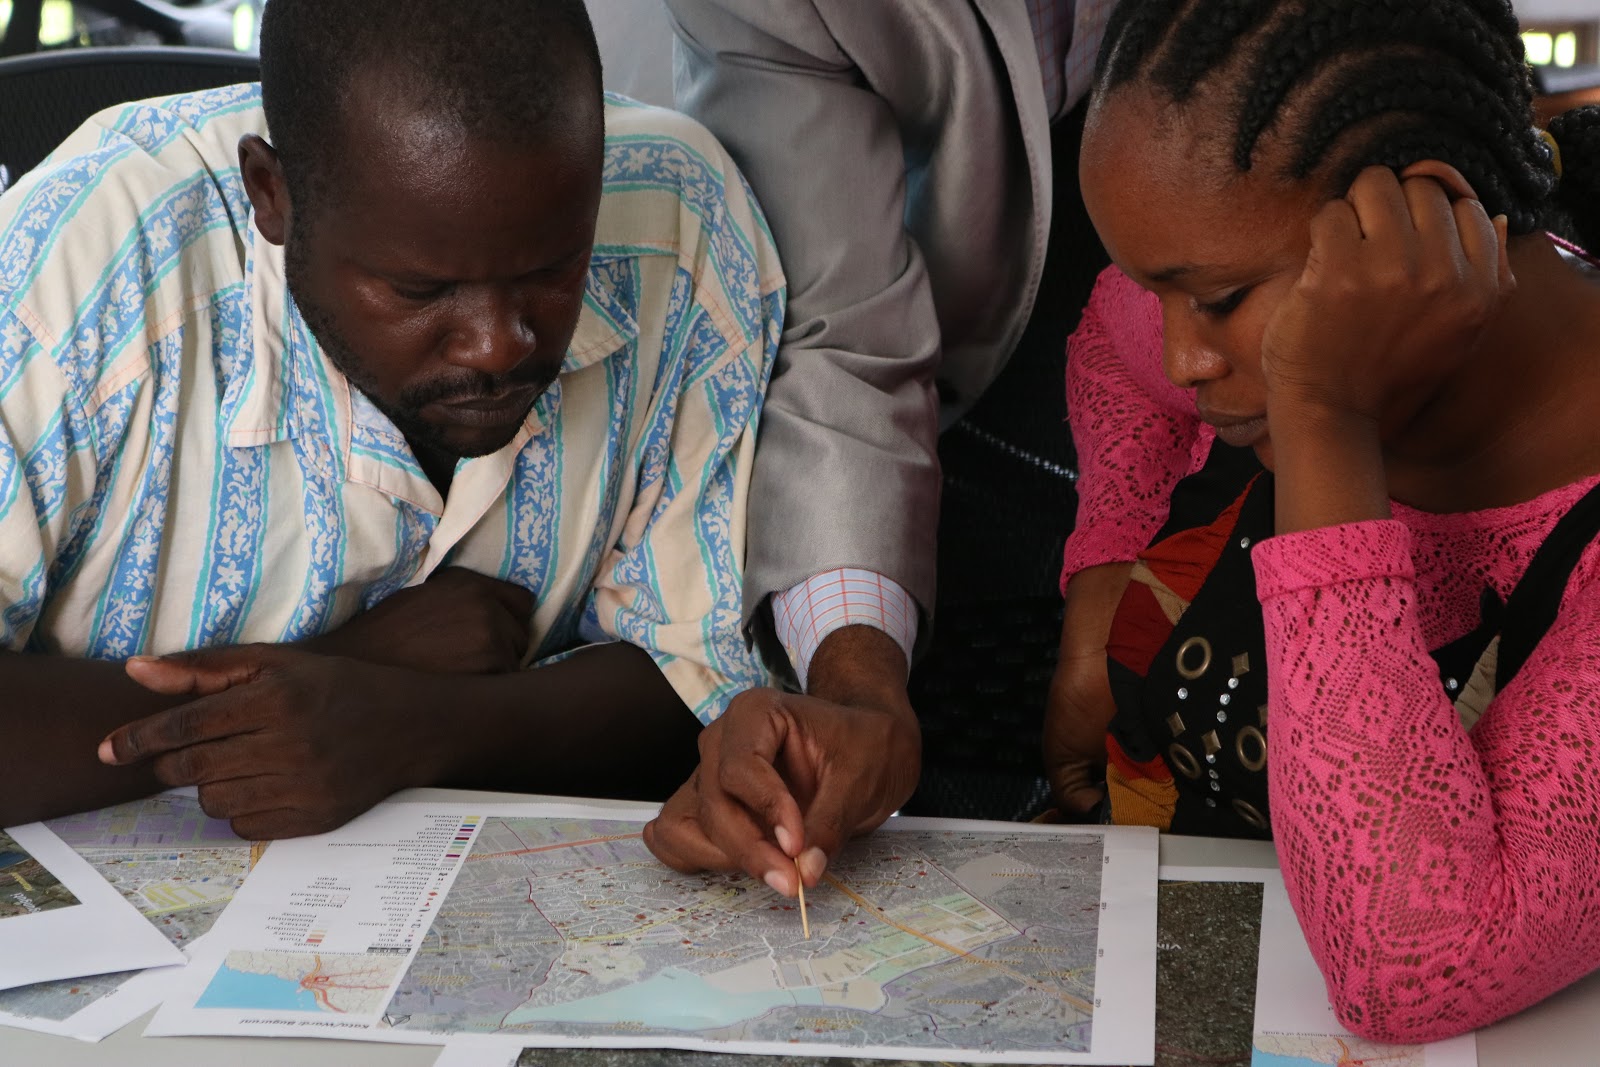
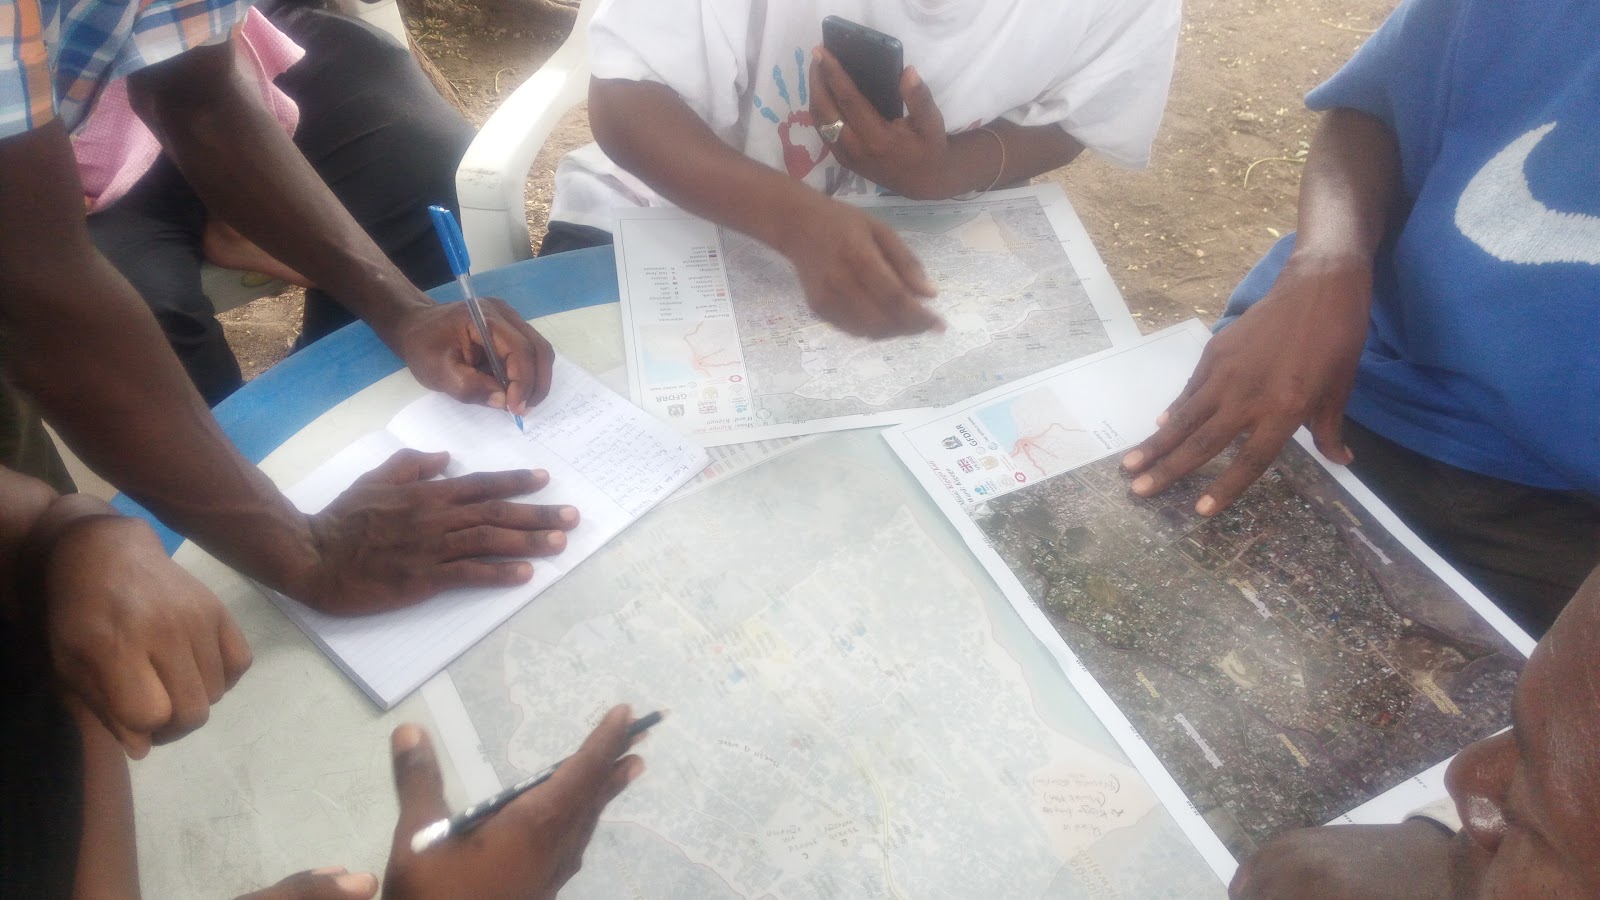
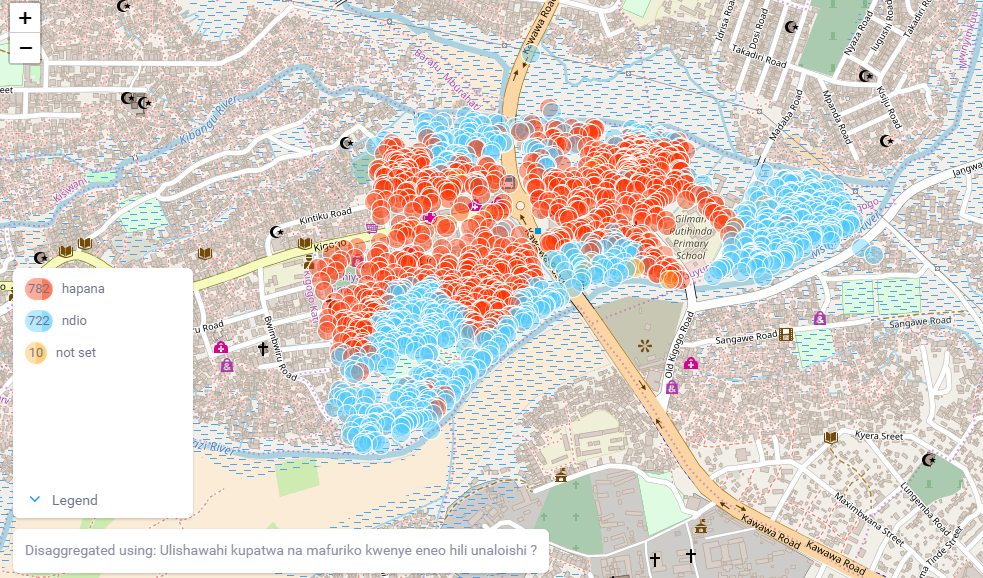
For the case of mapped subwards the exercise was a bit simpler because we already had data for them and printed a map on which community members identified assets and threats as well as any missing information. For the case of unmapped subwards, the task was a bit more complicated since it involved data collection of important features such as schools, hospitals, and open spaces on the specific wards, as well as cleaning that data. After this, students produced a map that community members then used as a base map in the community meeting to identify assets and threats on flooding, as well as missing information for students to recollect information so as to produce the final detailed map. 

Community meeting in Mlalakuwa subward- in Makongo ward. Students are working together with community members who identify assets and threats in the subward. Photo credit: Godfrey Kassano/Ramani Huria.

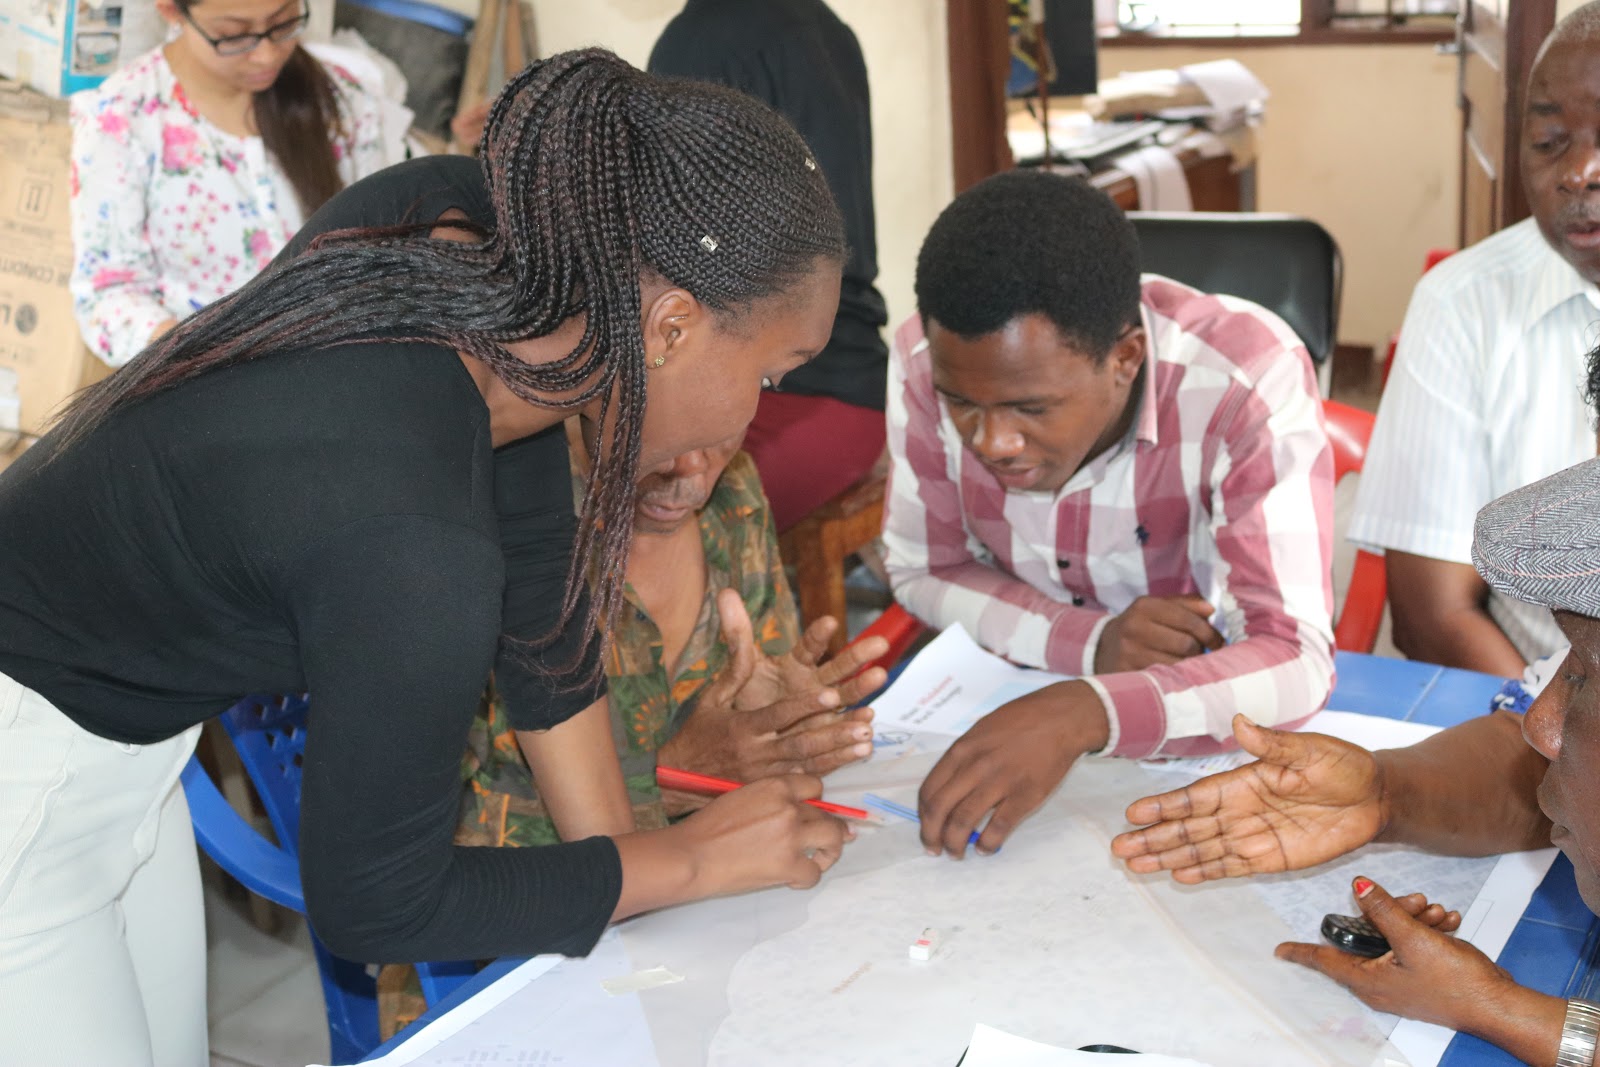
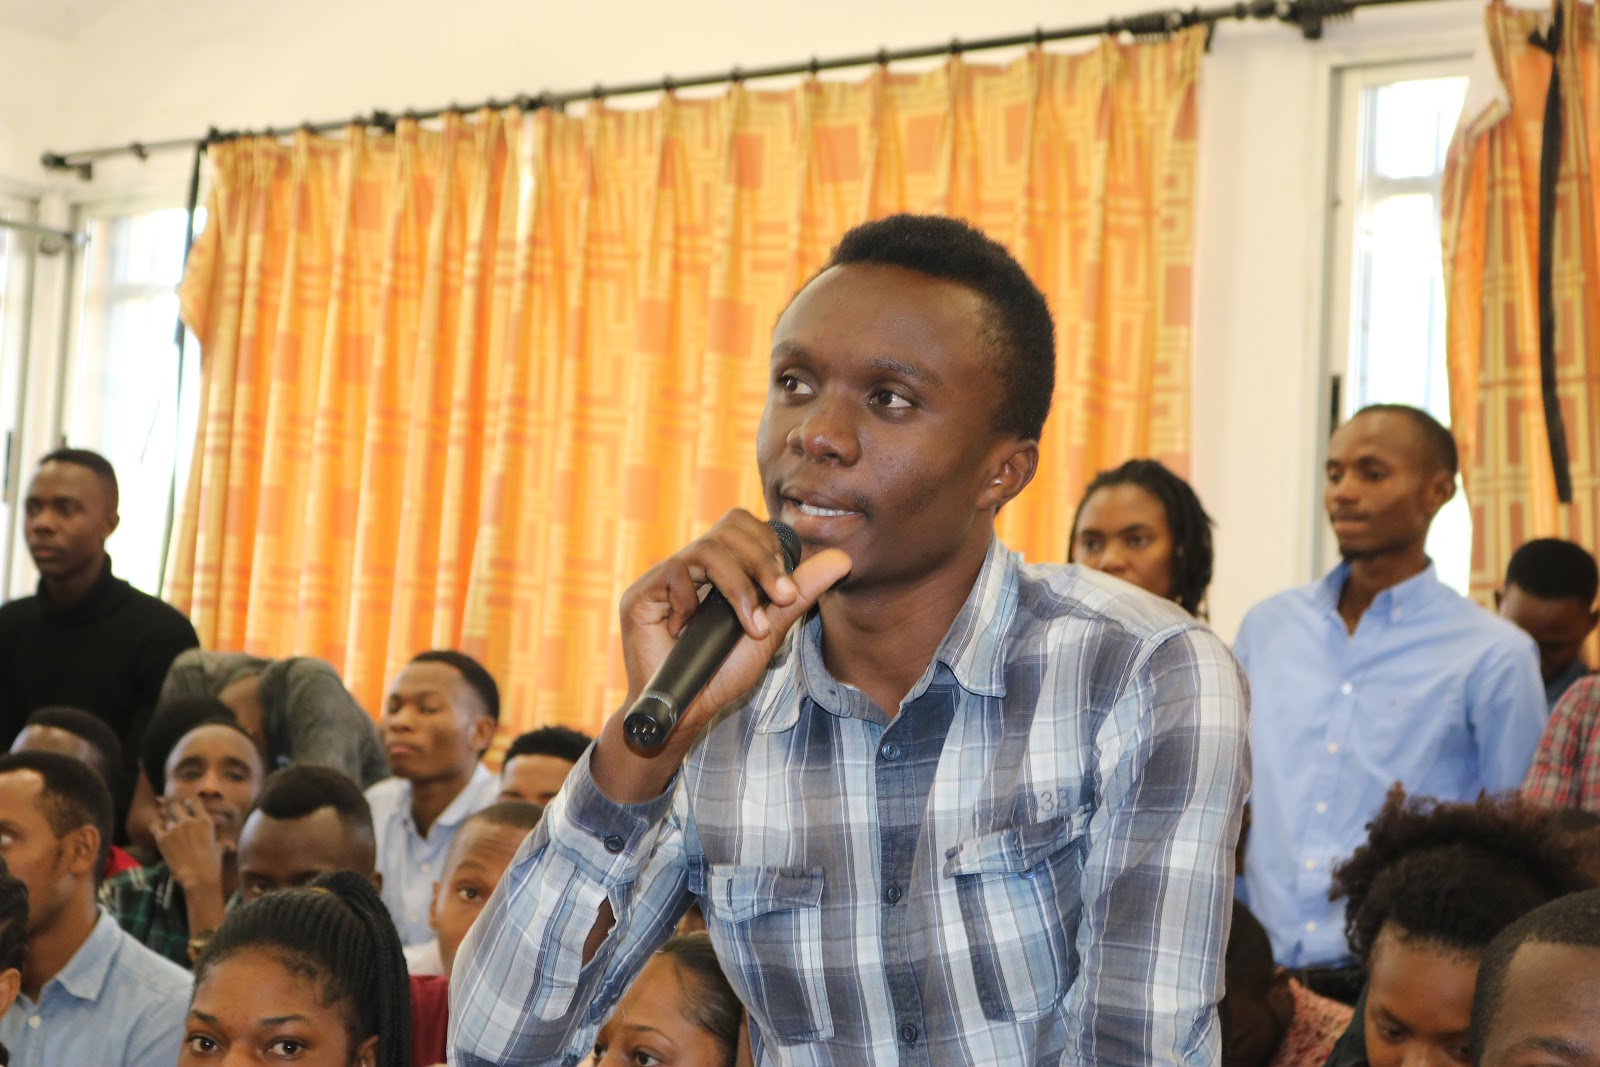
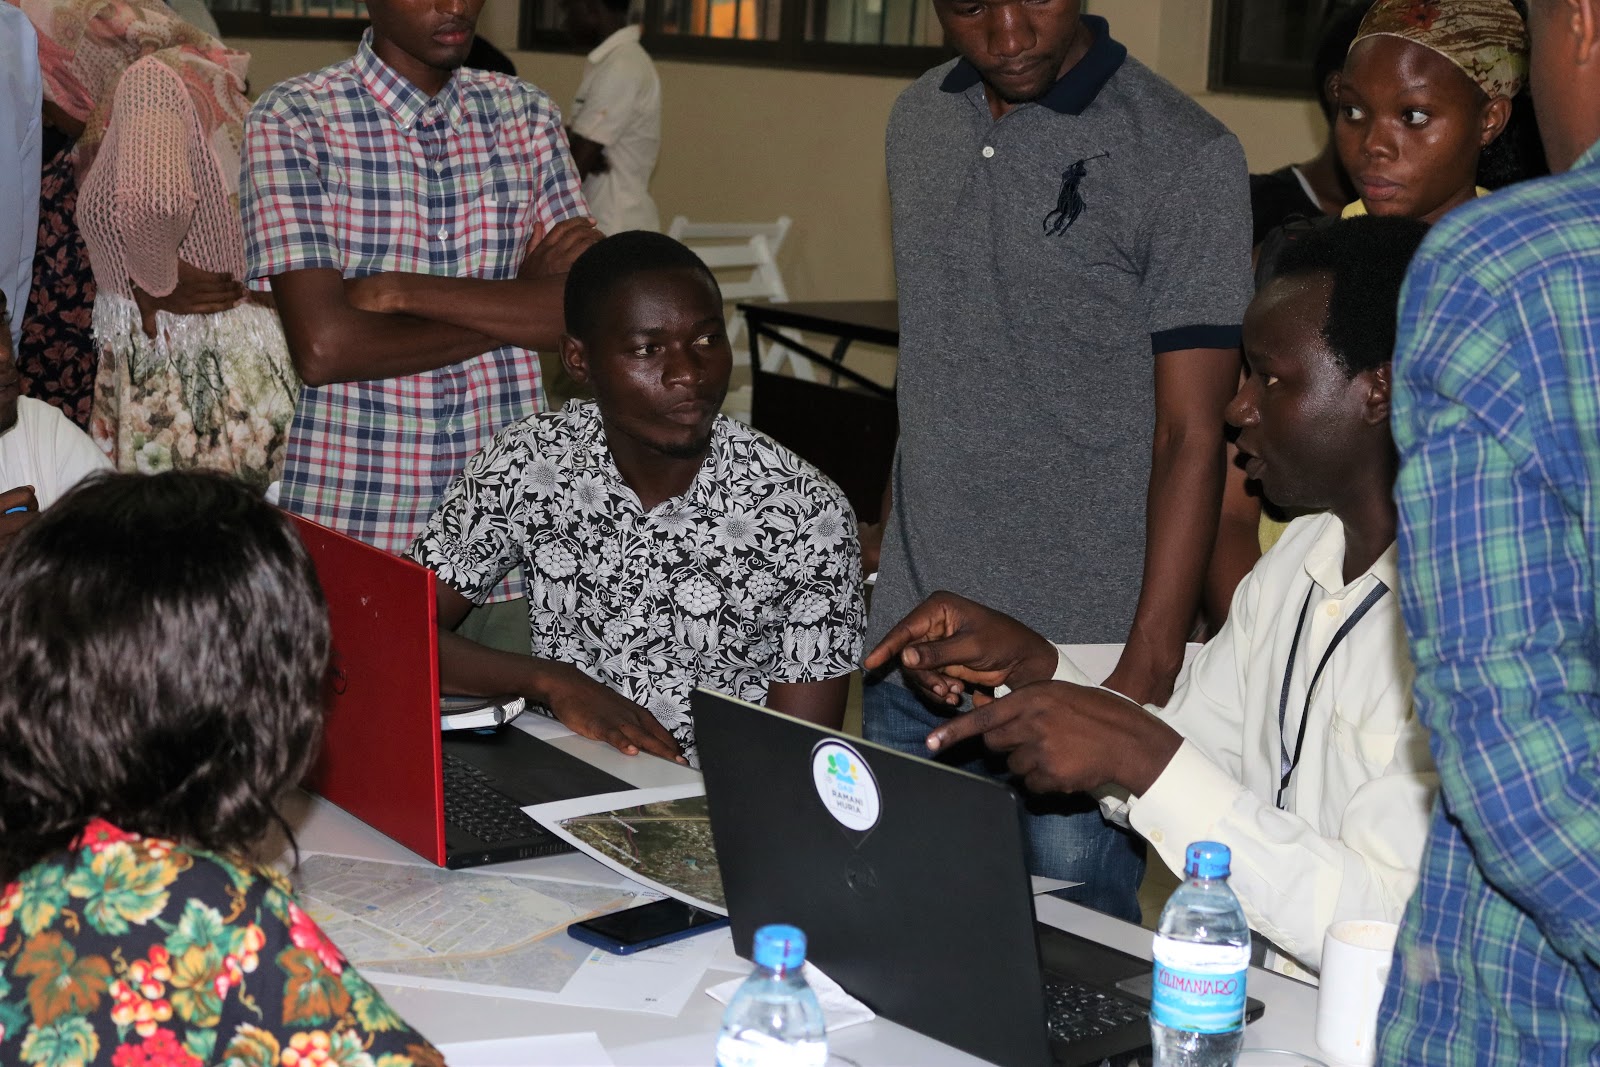
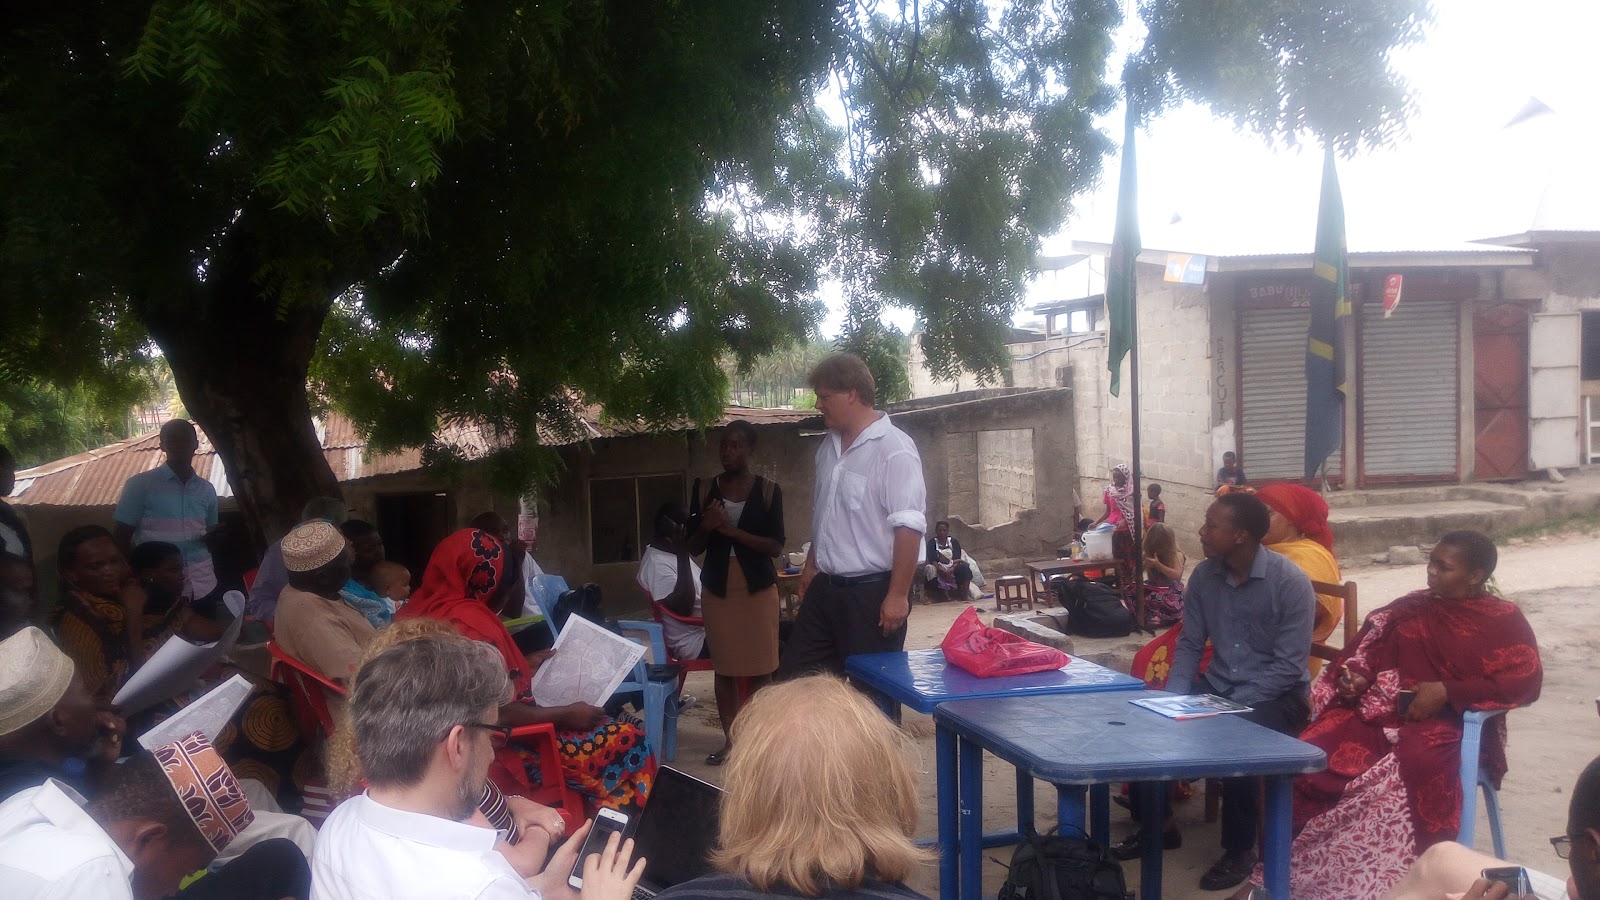
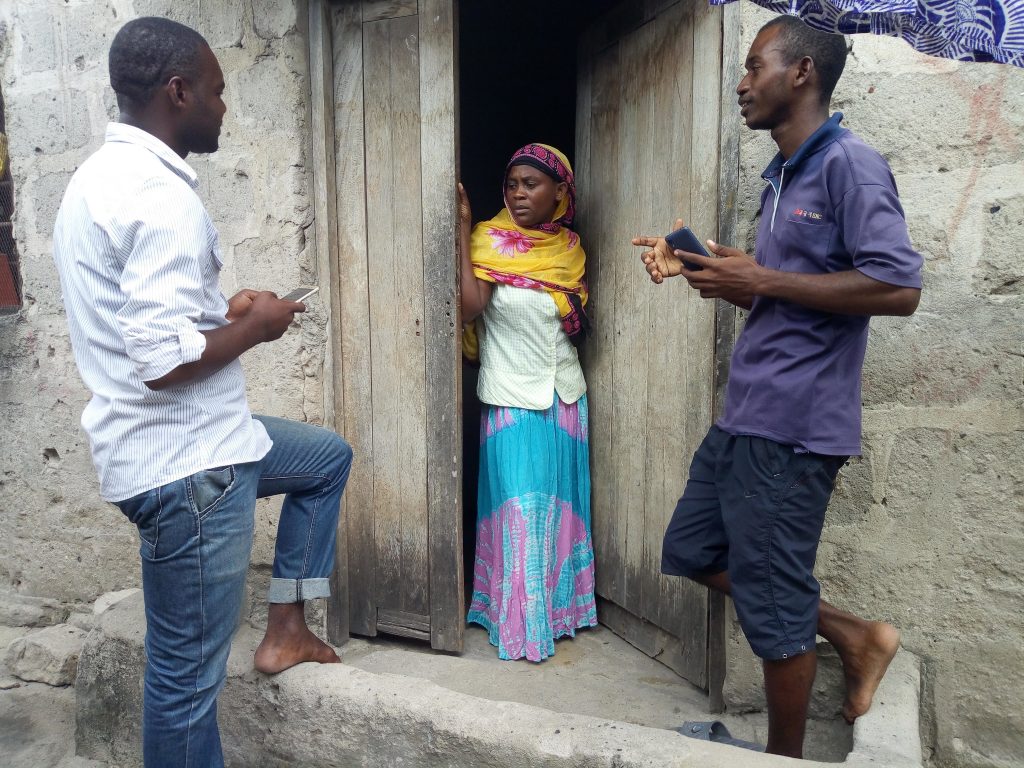
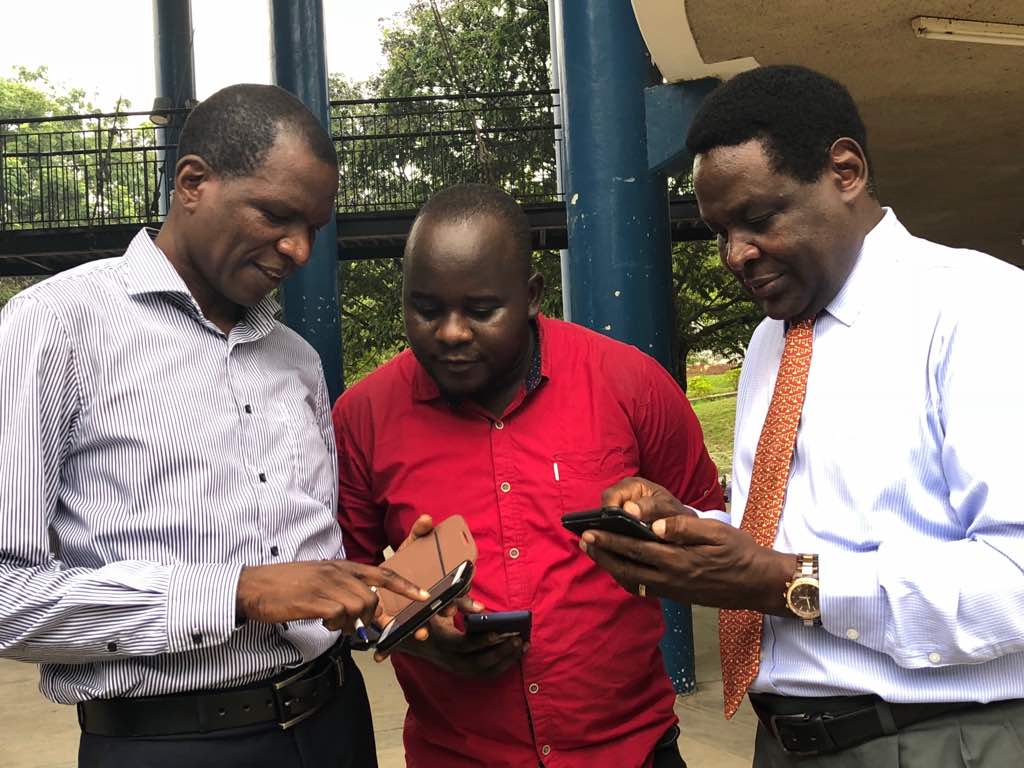
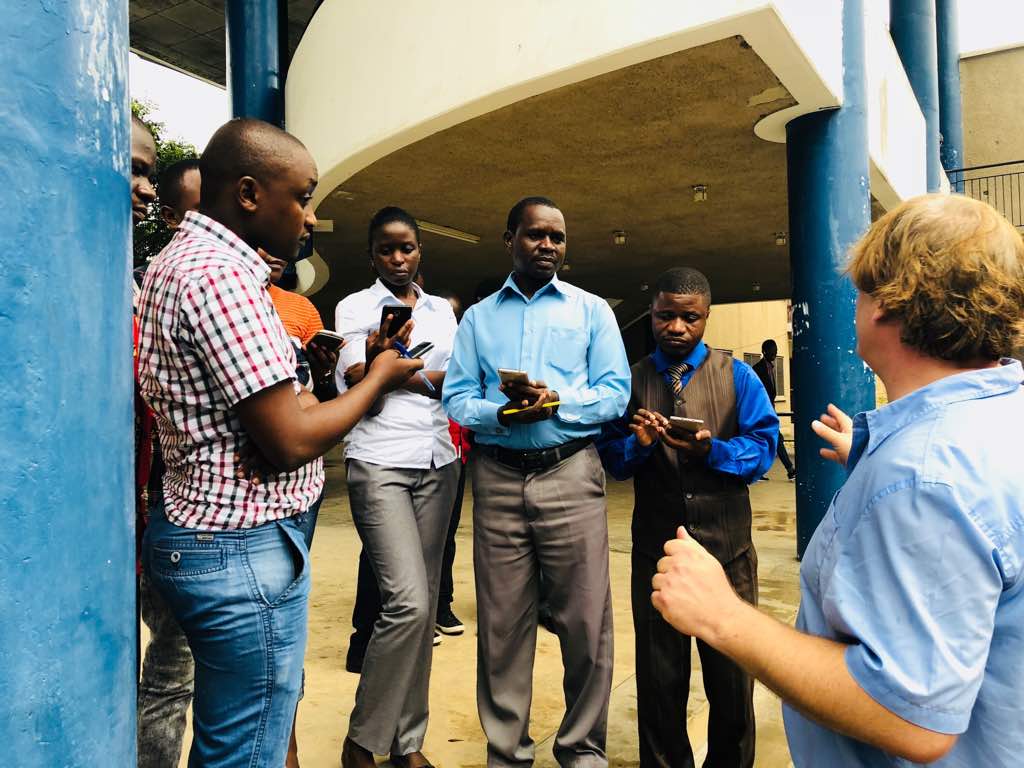
Within the subward, students arranged a meeting of about eleven participants, including ward wajumbe (representatives), subward executive officer, religious leaders, local youth and elders, subward executive officer and community-based organization (CBOs). A group of six students led by a student team leader facilitated the meeting by:

  • Introducing the team and the project to make community members conversant with the type of information they are about to share.
  • Splitting participants into groups of three – each led by two students for group discussion.
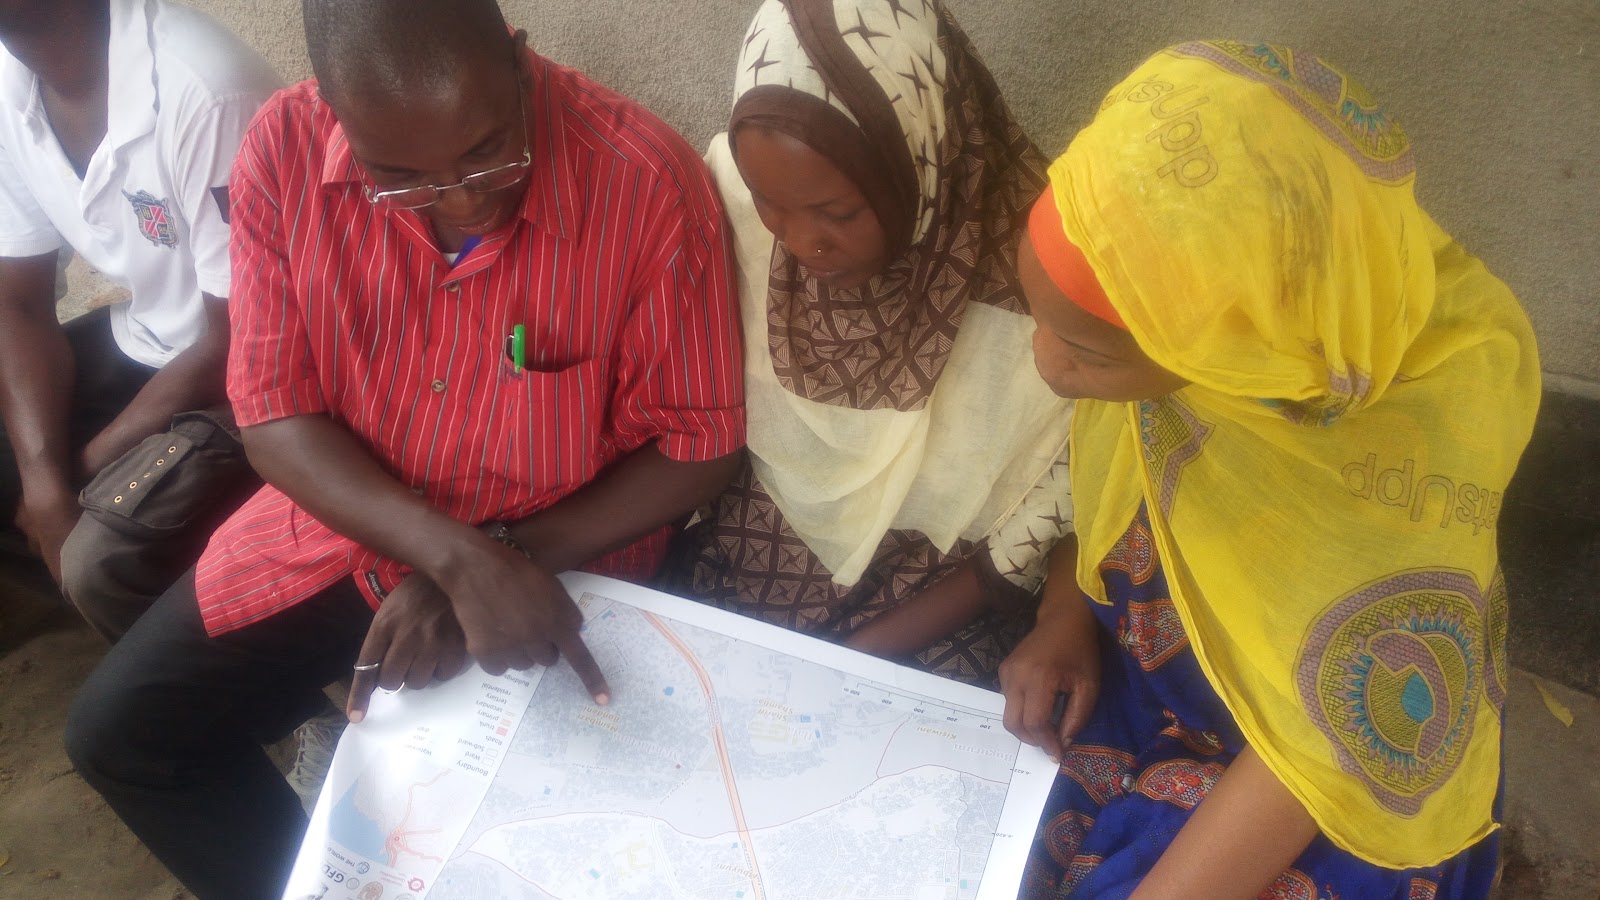
  • Distributing printed maps and tracing papers to all groups for them to identify assets and threats in the subward.

Students in each group made sure they collected all relevant information by asking questions and keeping participants engaged. The process of creating three separate groups ensured redundancy, in order to catch all information.

Community Insights During Mapping

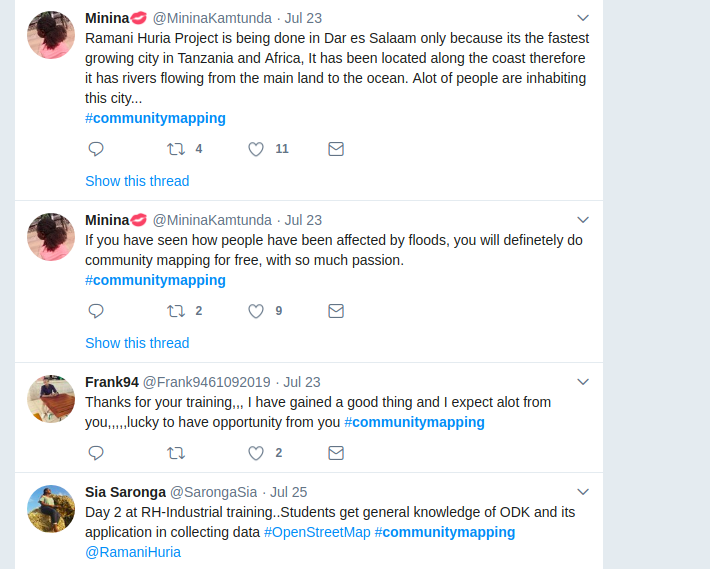
In conducting meetings, community members were excited about how engaging the project is. By involving them in all stages, from data collection to risk identification, it creates a sense of ownership and may increase data use as the community feels the data belongs to them. 

“We are very excited since most of the organizations usually come to collect data without considering community members, they only include the local leaders to gather information. Thank you for considering us as the community members.”-  Anonymous Community Member

Community members also suggest that feedback can be shared with them after data collection and analysis.

“Now that you have collected information from “my community” we will be happy to see the feedback of what you have obtained from your survey.” Paul Richard, Chairperson -Kilongawima subward, in Kunduchi ward. 

Challenges in Management and Involvement with Community Members

Managing a large group of students and producing intended outputs was a challenge, but by keeping them engaged, and by understanding the clear objective of the project they felt responsible and part of real change. This was done by raising up students who are natural leaders to support their fellows during fieldwork, this made them feel comfortable working together.

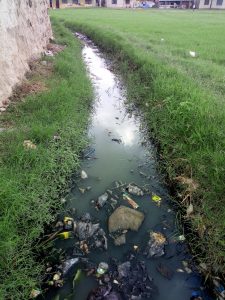
Involving community members/leaders in mapping is an excellent objective, but some of them expected to earn more money from the project, even threatening to stop working with us if we do not pay the amount that they wanted. To counter this, students explained the benefits of the project, which led to a better understanding and we worked smoothly with community members. This was possible by making them understand how the collected information will help them in flood hazard planning and prevention since most of them have faced floods almost every year. They became cooperative and provided reliable information which will help in reducing flood hazards in their neighbourhood.

Data Produced

Two main deliverables from the process are reports and maps, produced for each subward. A report consists of information gathered from a community meeting, conducted with local residents and leaders about the assets and possible threats perceived by the community. The map includes annotations that correspond to the report to better describe the situation visually. 

Students digitizing information obtained from community meetings in order to produce the final action map for a disaster management plan. Photo credit: Chris Morgan/World Bank.

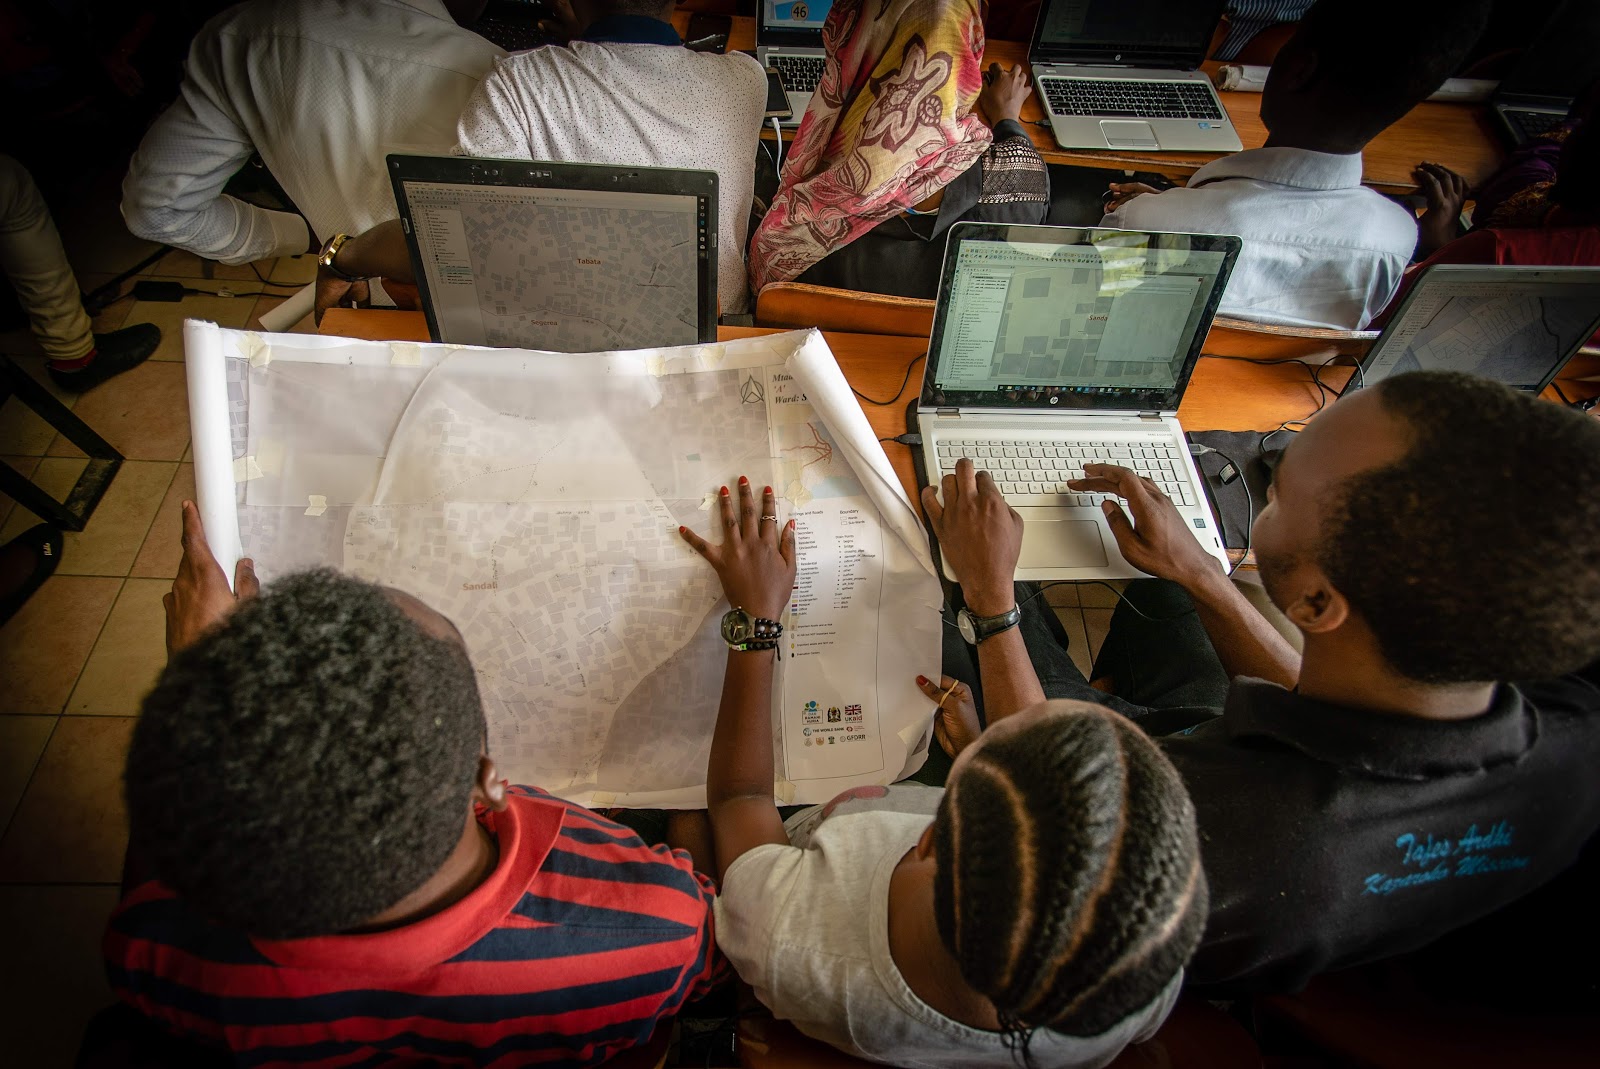
In addition to the data collectors, students worked in two teams to specialize in data cleaning and map making, to ensure the highest quality deliverables. The reports and maps will be used for risk reduction as well as disaster management planning in the wards by Deltares – an independent institute that has expertise in flood risk management. Together with ward leaders they will sit and develop a disaster management plan. In our next post we hope to share a Community Asset and Threat Inventory, our team is currently working on finalizing this.

COMMUNITY-MAPPED ELEVATION THROUGH “DIFFERENTIAL BAROMETRY”

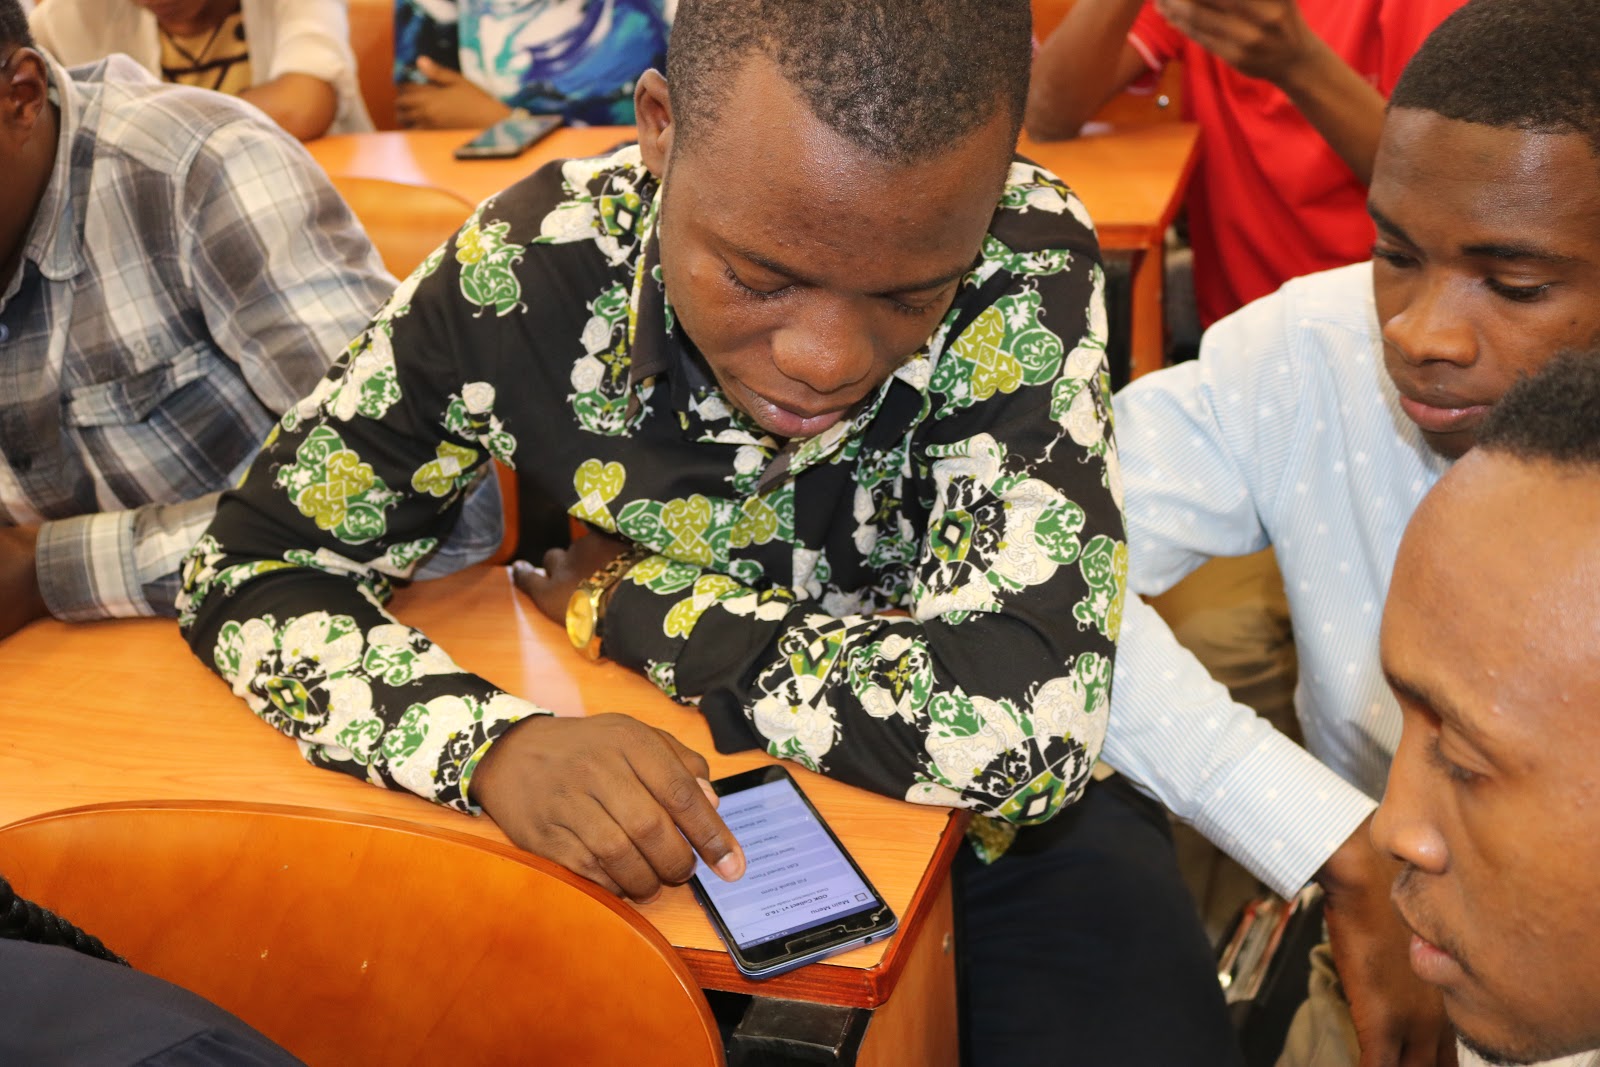
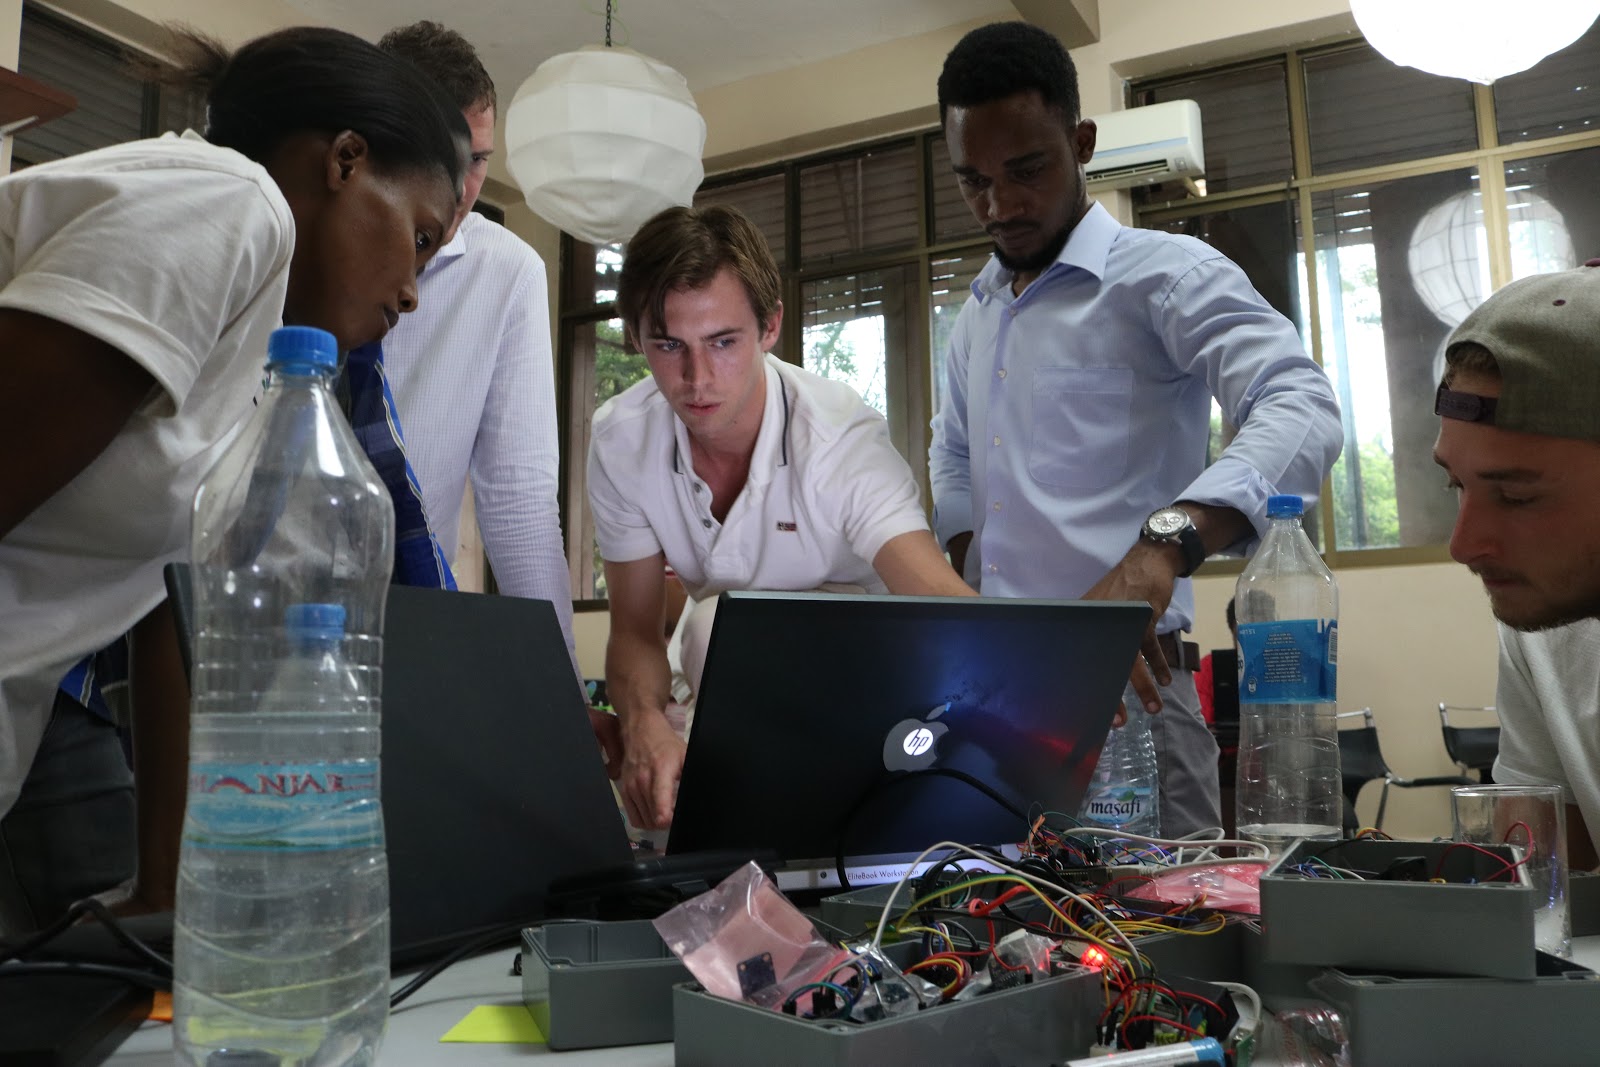
At the same time as the Community Asset and Threat Mapping, fifteen students from the College of Information and Communication Technology (COICT) – University of Dar es Salaam took part in a separate but related project about elevation and differential barometry. Understanding flood hazard and risk in complex urban water systems and vulnerable neighbourhoods requires accurate geospatial information. 

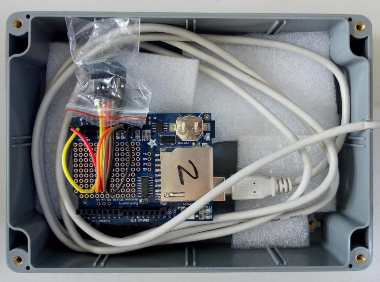
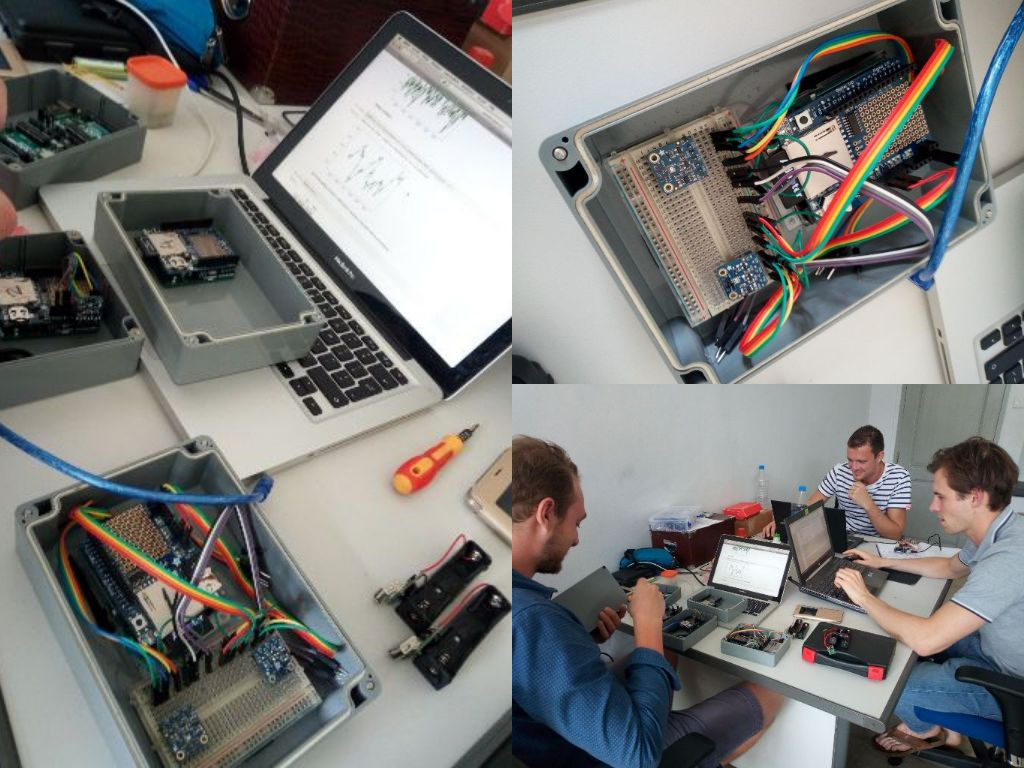
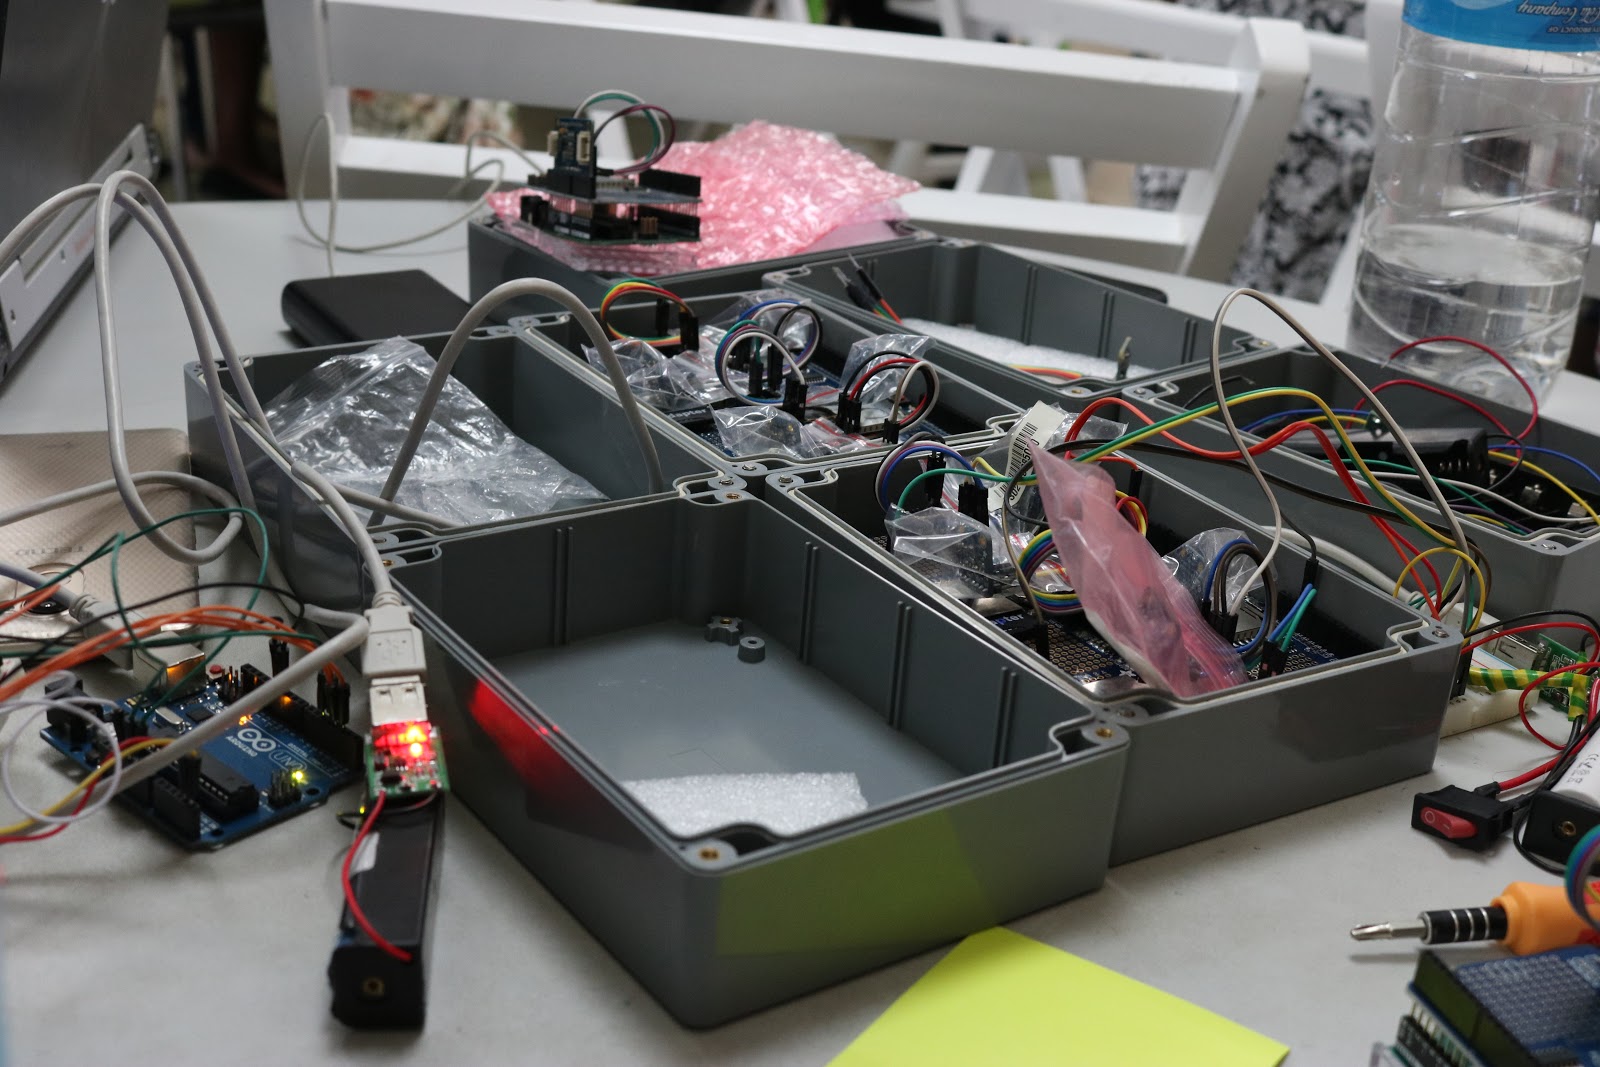
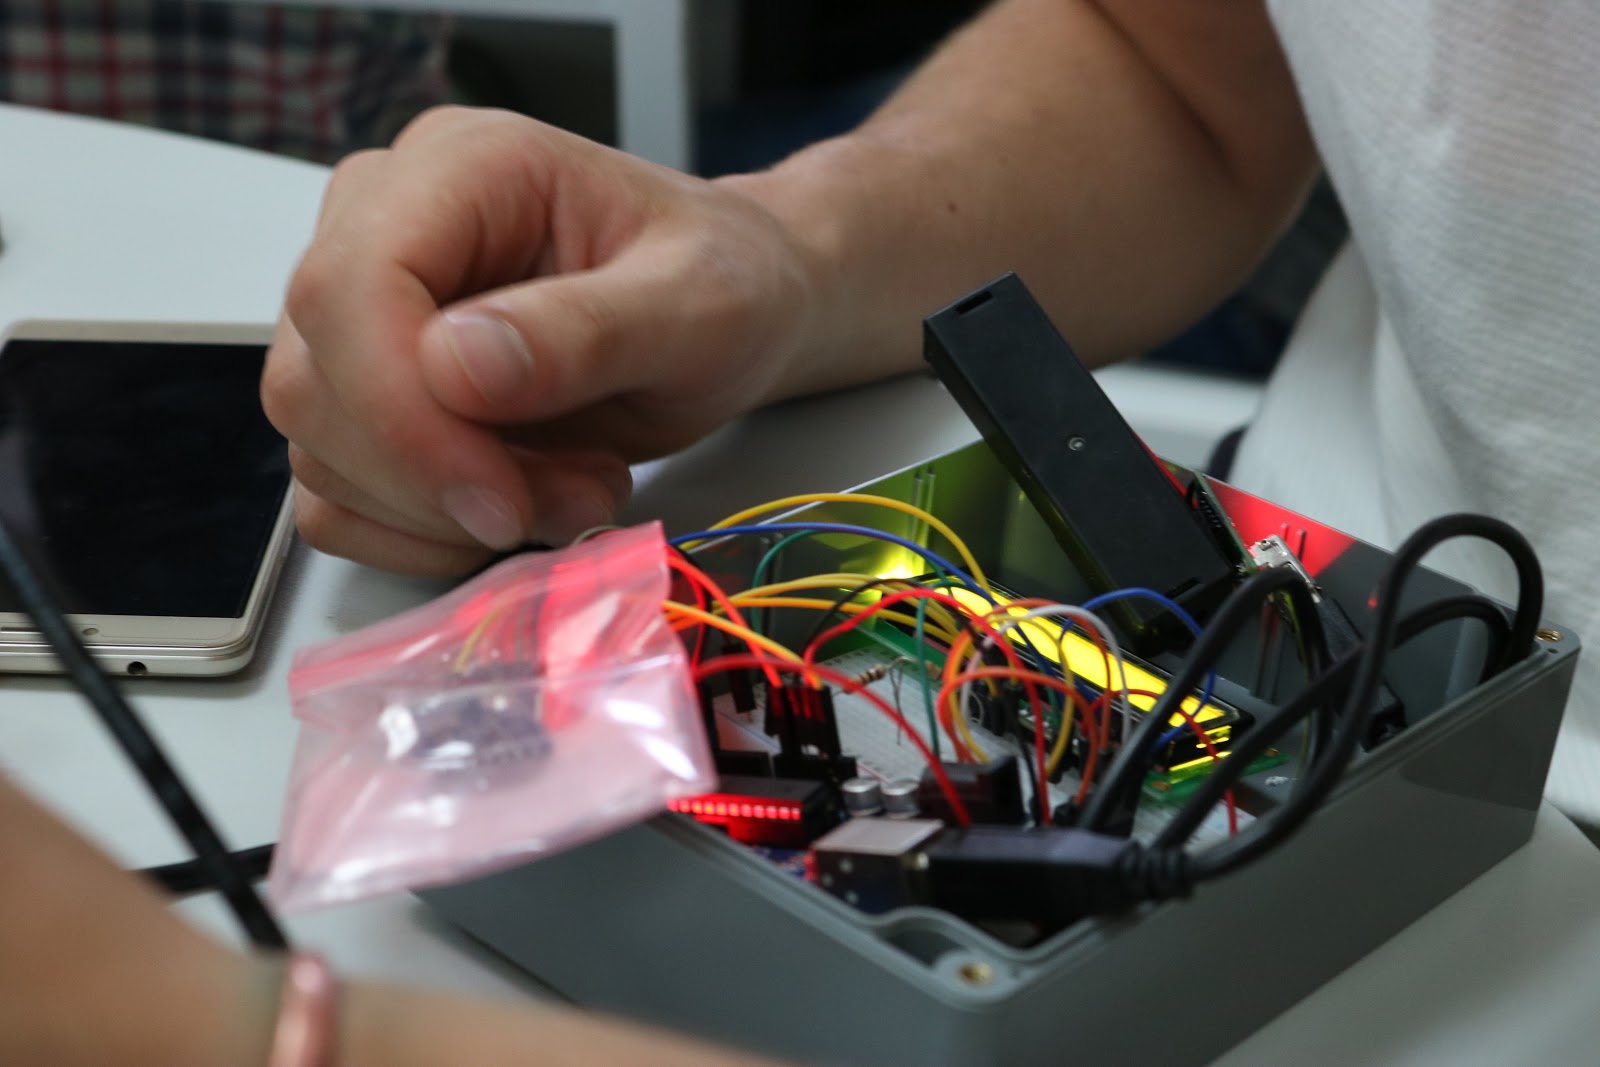
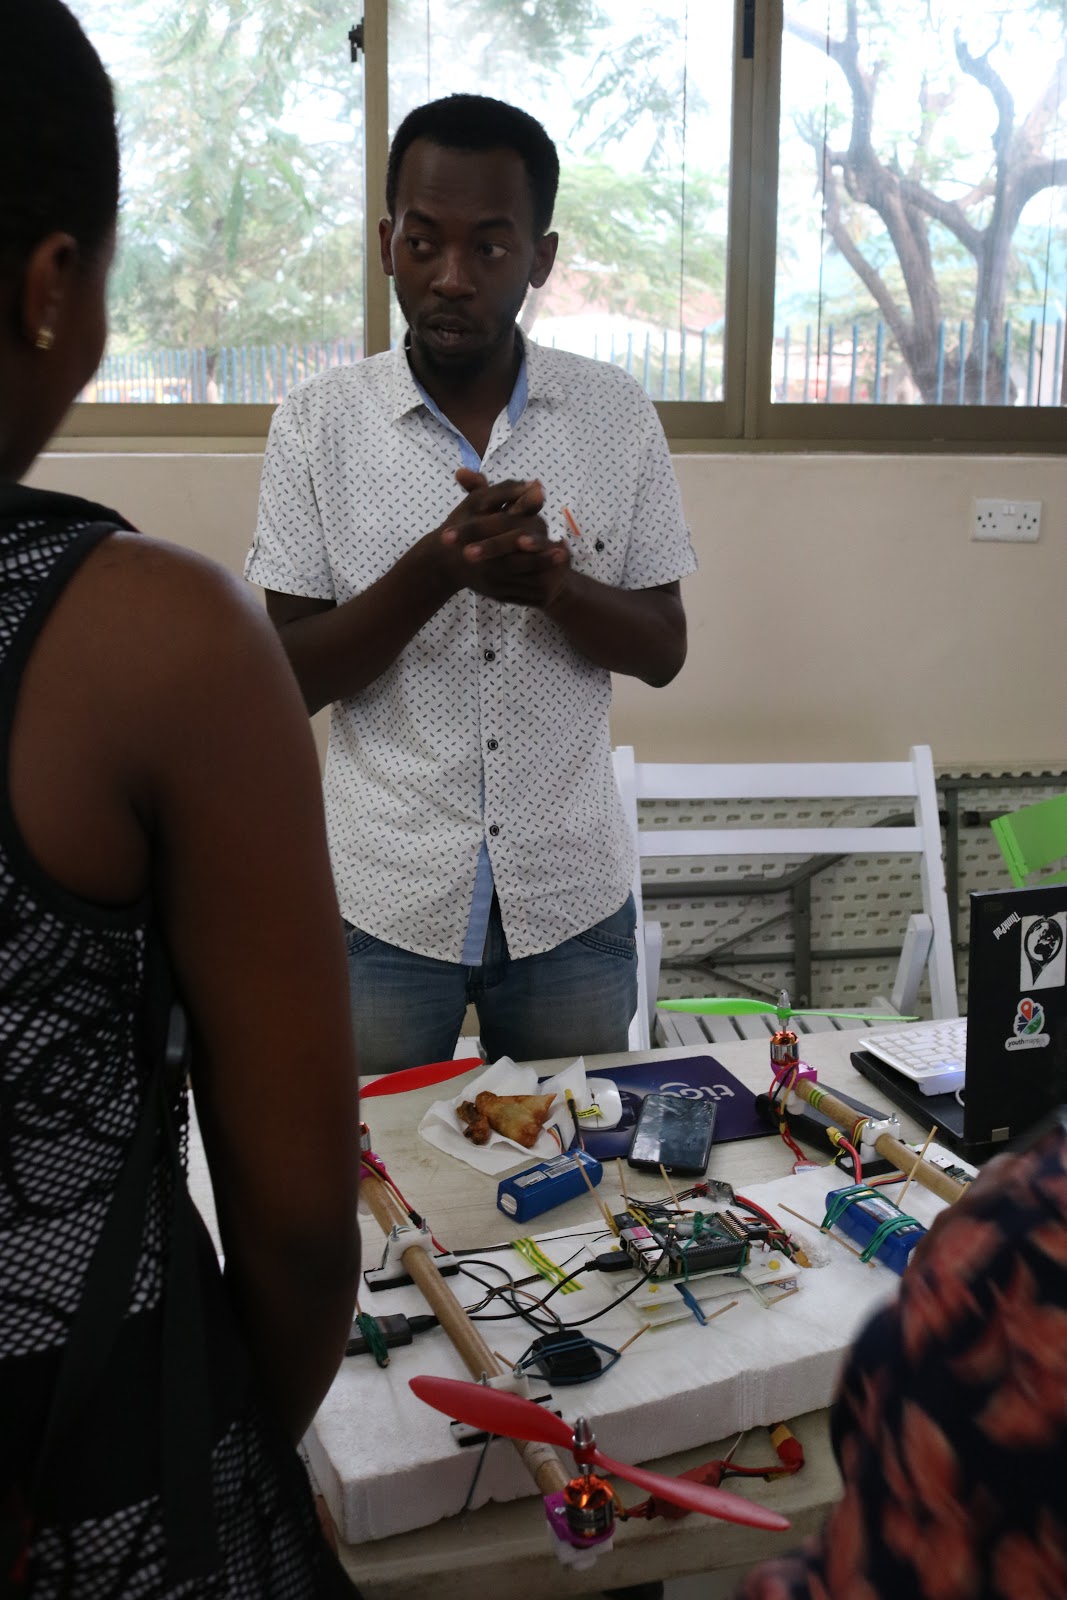
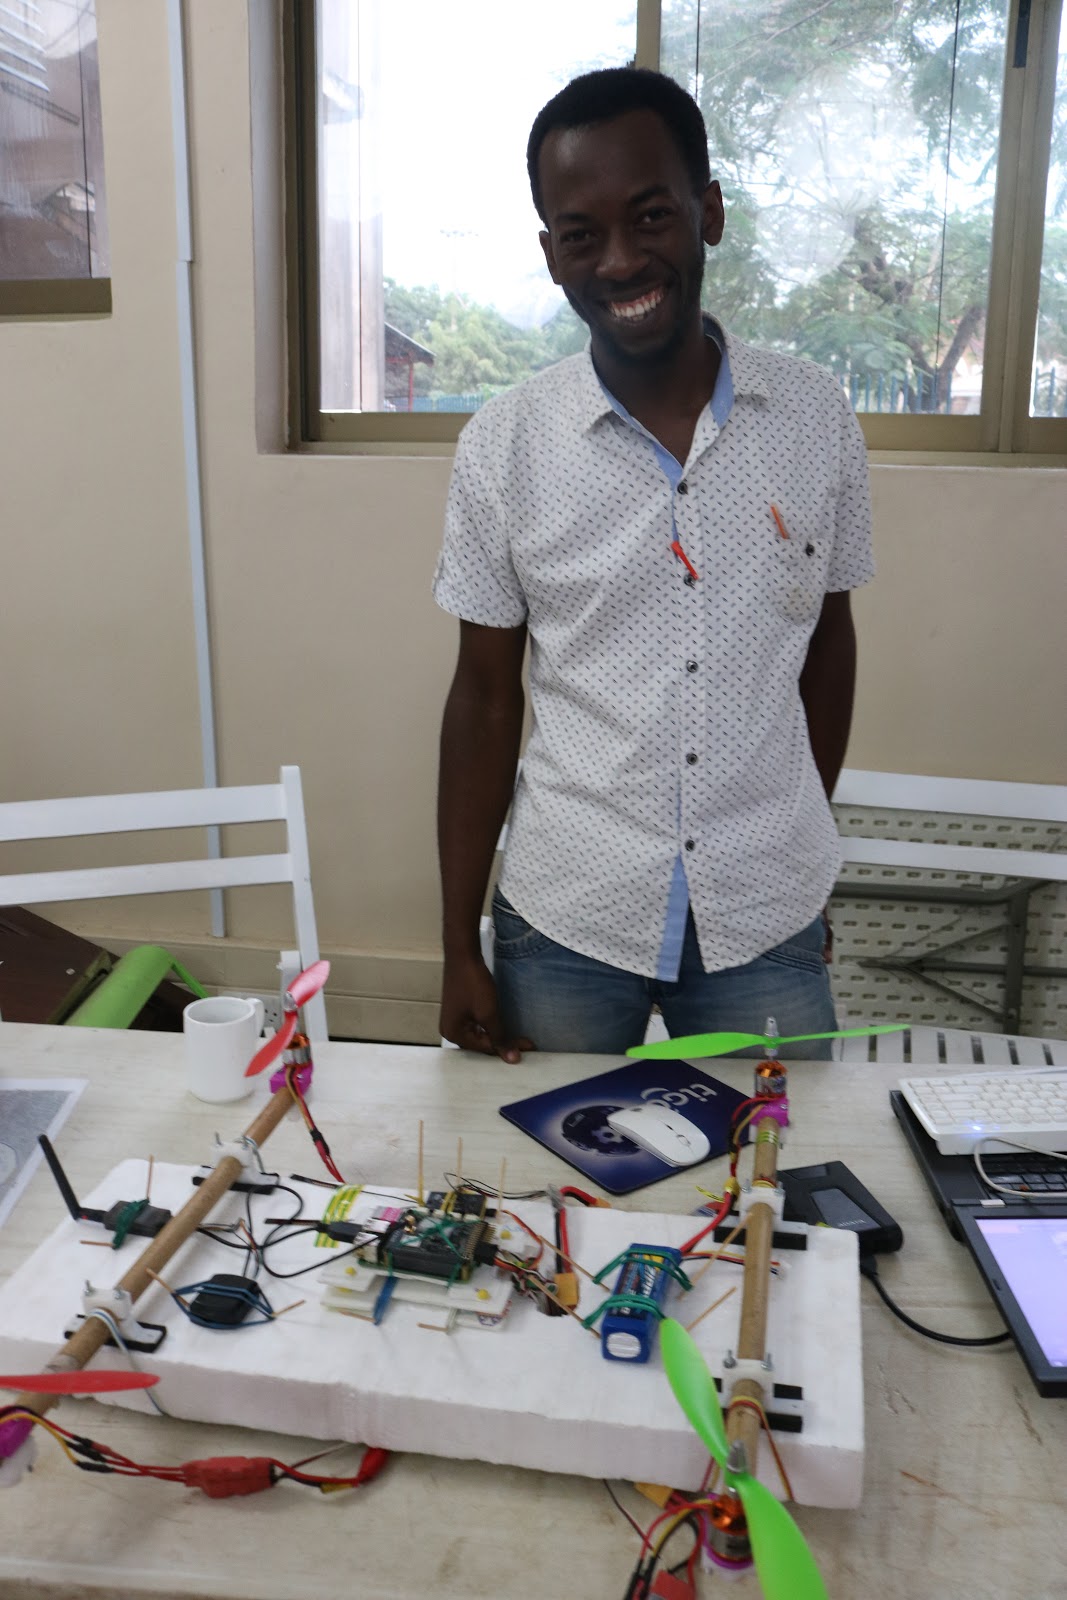
Obtaining elevation of surveyed areas is costly and technical knowledge is a must. This project tackles the two issues by using an Android application and cheap electronic devices: Arduino Uno and BMP280 (Barometric sensor). Any member of the community with a knowledge of using a smartphone can take part in mapping elevation of their neighbourhood with Differential Altimetry (Android app). For a period of 8 weeks, students assembled units (shown in the picture below) and carried out experiments in various locations around Ardhi University campus.

A device used to measure elevation using barometric pressure.

NEXT STEPS: SHINA MAPPING

After finishing the data collection for assets and threats, Ramani Huria is teaming up with Data Zetu to focus on our next big goal: shinas. The shina (roughly translated to “branch” in Swahili) represents the most granular administrative divisions that exist in Tanzania. One key to mapping shinas are wajumbe, or shina leaders, who are the first point of contact for local households over issues such as public services, resource allocation and community challenges, such as theft etc. 

Shina Mjumbe at Tabata Subward in Tabata Ward giving direction to the student when tracing her shina boundary: Photo credit: Godfrey Kassano/Ramani Huria.

Wajumbe are chosen by their community to act as their liaison with the local government. These shinas were originally comprised of ten household clusters – 1 representative per 10 households – but due to increases in population and urbanization, these hyperlocal areas now contain between 30 and 150 households. Mapping shina boundaries will provide community members and service providers, such as emergency responders and public health experts, and efficient and more precise method to locate households at a smaller scale. Being able to locate themselves and other community members at the shina level reduce the amount of time it takes for services, such as emergency response, to reach households in the case of, for example, a flood or fire.

Look out for our next post to see final products for assets and threats throughout Dar es Salaam, as well as mapping progress on shinas!

Categories
Uncategorized

Two Hundred Subwards of Dar es Salaam to be Mapped by University Students in the Next Six Weeks

On the 23rd of July 2018, Humanitarian Openstreetmap Team (HOT) began scaling up the World Bank funded Dar Ramani Huria project, training over 400 students who will map flood hazards in Dar es Salaam.

This year Ramani Huria is working with students from the University of Dar es Salaam and Ardhi University, aiming to extend to other universities in following years such as Sokoine University of Agriculture in Morogoro and the State University of Zanzibar.  The students participating in this summer’s program are from diverse academic backgrounds, including participants studying Urban Planning, Geomatics, Community Development, Environmental Science, Geography and Environmental Studies.

The increasing hazards of climate change, rapid urbanisation and population growth, are all contributing to increased flooding in Dar es Salaam, a situation which is set to escalate as the population expands from the current  five million people to almost double in the next ten years. This tremendous increase in population growth has resulted in a city comprised of over 70% informal, unplanned settlements, with a significant number of lower income inhabitants living in hazardous areas i.e. along major flood zones  such as the Kibangu, Msimbazi and Ng’ombe rivers.

Particularly for vulnerable populations, such as those living along the flood plains of Dar es Salaam, the need to be on a map is crucial. Mapping vulnerable communities proves their existence, their rights and their needs. By training local students to add to the map, we are empowering them, as future decision makers, planners and engineers, with new tools and knowledge, to make sure that every inhabitant is counted. 

“To be on a map is to be acknowledged, is to be known, is to be recognised, is to be counted. It is for the world to know that you are there and that you have needs, that you have dignity, and that you have rights.” – Ivan Gayton, HOT Tanzania Country Manager

 Photo: Students are introduced to the Ramani Huria project during Industrial Training, July 2018. Photo credit Ramani Huria.

This summer, Ramani Huria will map 44 wards – about 200 subwards of the city – affected by floods in Dar es Salaam. To achieve this, more than 400 students will be trained to use simple and economical tools to map. The mapping will be done by conducting community meetings in these subwards and allowing community members and ward/subward leaders to identify assets (things that are important to them), threats (things that the community thinks may flood if the hazard continues unabated) and issues that contribute to flooding in their subward. A report on the pilot community meetings for this project can be found here

The training kick off took place at the University of Dar es Salaam’s College of Information and Communication Technologies (COICT) Kijitonyama. Originally, 350  students were expected to join, but almost 600 hundred students arrived to join the programme. At first, it was a bit challenging to respond to the extra number of students, especially for the management team, but it was amazing to see such a big group of people interested in the project.

Introduction of the Project 

The project was introduced to students by World Bank Community Engagement Consultant Nyambiri Kimacha, who mentioned how important the project is to the communities directly affected floods in the city and the students who are learning new technologies and simple mapping tools. She also showed her gratitude to the students who had signed up to the training,  

 “It is amazing to see all of these students (600) coming together to map the city to help in flood resilience.” – Nyambiri Kimacha, World Bank Community Engagement Consultant

HOT Tanzania Country Manager Ivan Gayton introduced students to the different activities that Ramani Huria is doing including drone development of a quadcopter, drainage mapping, elevation measurements and community outreach events. He motivated students to work together in helping the community in need who are affected by flooding, and also inspired them to learn new skills and develop their career goals.

Photo: A student asks for additional information  during July 2018 Industrial training, Photo Credit Ramani Huria

“If you have seen how many people are affected by floods you will do community mapping for free! And with passion.” – Ivan Gayton, HOT Tanzania Country Manager

Briefing of Tools and Software 

After this welcoming note from both HOT and the World Bank, students were introduced to the community mapping methods, open data and open software that are used for Ramani Huria. They learnt the importance of using open data in humanitarian response and how the international community that is utilising open data is expanding. Examples of the open software that Ramani Huria uses for data collection, processing and map production was introduced, including OpenDataKit (ODK), OpenMapKit (OMK), QGIS, and JOSM.

Photo: Ramani Huria GIS Specialist Iddy Chazua gives a briefing about GIS data formatting at Industrial Training July 2018; Photo credit Ramani Huria

Students were introduced to the OpenStreetMap (OSM) platform, an online database that is a free, editable map being built by its users. OSM stores enormous amounts of data which is collected by local communities and remote mappers across the world .

“OSM data is from the (global OSM) community. OSM is owned by the community. You are the community, feel proud to be part of this community.” – Iddy Chazua, HOT Tanzania GIS Specialist

We had a lot of tweets coming out from students with the tag #communitymapping  about the training. The tweets demonstrated how excited the students were to be part of the OSM community.

Screenshot: some students’ tweets during the training

After the first day of orientation to the project, the students moved to the main training venue at Ardhi University, one of the key partners on the Ramani Huria project through which many student mappers have previously been recruited. The students were split into groups to receive more training. There are now six groups of about 100 students each with a diverse range of ages, genders and academic studies. Each group is led by one senior supervisor and three junior supervisors.

Trainings

During the first week of training there was an introduction training on different software and applications that we use in mapping.

The software included, JOSM, OSM, and HOT Tasking Manager, OpenDataKit (ODK) & OpenMapKit (OMK).

Photo: Students working  together to explore the OpenDataKit (ODK) android application during the training, Photo credit: Ramani Huria.

Using ODK and OMK is an easier way to collect enormous amounts of data since most students own android phones. These two applications (ODK & OMK) will be used by students to collect information in the field. Students have been learning practically how to collect field data using ODK and OMK, and have also been trained on how to create surveys on ODK to make them have a clear understanding on how the questions have been developed and deployed.

Photo: Field practice, students learning how to fill out an ODK survey. Photo Credit Ramani Huria

In celebration of World Clean Up Day which will be celebrated for the first time in Tanzania on the 15th of September 2018,  students will map trash in the city (mapping all formal and informal waste points in the city) using ODK. Ramani Huria will map trash in the city in collaboration with Nipe Fagio  the appointed lead partner in Tanzania by the Let’s Do It Global Foundation, for what has been called ‘the largest positive civic lead movement in world history’, with the aim to unite 5% of the global population in a one-day cleanup action, and making a plan to keep it clean. This will be the first real field experience for the students before commencing on mapping the 44 flood-prone wards of Dar es Salaam. 

We will keep you updated on the progress of this large group of motivated students and the progress they are making in mapping a more flood resilient future for Dar es Salaam.

Categories
Uncategorized

Community mapping for flood modelling 2.0

Dar es Salaam’s Ramani Huria 2.0 project is one of the most comprehensive community mapping projects currently ongoing. A large use case for the collected map data is improving knowledge on flood hazard, vulnerability and exposure, all three components of the risk framework. Mapping of the type, dimensions and state of the drainage network is an important component and has the potential to establish detailed flood inundation models that can be used to simulate floods at unprecedented scales. Earlier, we reported on the state of the drainage mapping after Ramani Huria 1.0. Now, all drains are being remapped with a detailed drainage model and with attention to connectivity. The first 20 wards have been mapped and in this blog we report how well underway we are.

By: Hessel Winsemius, Hawa Adinani, Amelia Hunt, Ivan Gayton, Iddy Chazua, Amedeus Kimaro, Paul Uithol

Flooding near Jangwani bridge on 15 April 2018

A specialized Ramani Huria drainage mapping team has been active in surveying drainage data, cleaning and quality checking with the result that there is now accurate drainage data for Mikocheni, Msasani, Kinondoni, Mwananyamala, Sinza, Kijitonyama, Hanansifu, Ndugumbi, Makumbusho, Mzimuni, Tandale, Manzese, Buguruni, Vingunguti, Magomeni, Kigogo, Mchikichini, Ilala, Mkurumula and Mburahati. Let’s show you the results with interactive maps, and refer back to how we did it.

QGIS layout of all drainage data available in June 2018

How well are we following the data model?

Interactive map for data model accuracy. Click on the top-left draw down menu to check the completeness of different tags. You can zoom in and out to inspect details.

In the interactive map shown above, the progress in mapping can be found. The maps shows all linear features mapped so far, that in any way are related to drainage. These include channels, culverts, ditches and underground drainage. For each drain, a number of attributes should be collected, following a pre-defined data model. This ensures that for a specific drain with a specific shape, the right information is collected. A drainage data model was setup that is followed as accurately as possible in this way. We explain a bit more about this below.

The initial view of the interactive map shows the quality assurance of the ‘drainage type’ attribute, which has to be filled out for any drain being mapped. The colors in the map show ‘green’ where a correct value has been filled out, yellow, where a value was filled out but it does not follow a pre-defined set of possible inputs, orange, where an invalid data type was used (for instance a string instead of an integer) and red, where no value was entered. Summarising, you are looking at quality flags for tags to be collected. You can click on the drop down menu to select quality flags for different tags. And you’ll see that the mapped tags are mostly complete. To ensure the completeness, we have developed and applied software to quality assess how well the data model has been followed. The code for this is continuously developed and available as open-source tool including examples and documentation on https://github.com/openearth/hydro-osm. The Ramani Huria drainage mapping team now uses this software on a daily basis to assess the quality of drainage features in recently mapped areas.

But what do the black lines mean?

Since our last data quality check, a lot of changes have been made to our data quality routines. We are now able to handle “conditional data models”. This means that for instance certain attributes must be collected only when other attributes already apply. For instance if a drainage type is culvert, then also identify what culvert shape it should have (boxed rectangular or round). And if a round drain is found (such as shown in the picture below), then also measure the diameter, while if a rectangular drain is found, also map the width, and box height. The drainage mapping team prepared a very extensive data model, for drains as well as other features in the city, which follows this conditional model.

Example for a culvert, a typical closed circular drain, requiring collection of the height above the neighbouring street, diameter, material, state and blockage.

Dar es Salaam/Ramani Huria – OpenStreetMap Wiki

Data collected as part of Ramani Huria conforms to a model. The Data Model specifies what types of attributes are…wiki.openstreetmap.org

The importance of mapping the right attributes for each feature are large. Dimensions are necessary to understand how much water can be transported through a channel or other drainage feature. The maintenance state is important to understand how much obstruction can be expected within the channel network and can possibly be used to simulate the effect of the poor drainage state compared to if the state of the drains was very good.

How do we collect these attributes?

To enable community mapping teams to collect these data in such a complicated conditional data model, we use the OpenDataKit tool (ODK). ODK basically guides a surveyor through a number of questions in a very intelligent way through a smart phone application. ODK can run offline with temporary storage on the phone. When connected, the surveys can be uploaded to a central server. ODK will ask conditional questions. For instance, it may first as “what feature are you mapping”, where you can answer building, street, drain, and so on. After that, if the surveyor enters drain, it may ask “what type of drain”, and then based on the type of drain ask for additional details such as shape and dimensions. In this way, the conditional data model is followed accurately. For more information on drainage observations and tools, we refer to our blog on Building Open Tools to Map Drains.

An ODK survey page

How well is the drainage network connected

The first interactive map showed how well the required attributes were collected. This is one important aspect of drainage data. Another aspect is connectivity. In a sound urban drainage network, you would expect that one drain is connected to the other, and that eventually the network would reach a downstream outlet in a larger stream, river or the ocean. In our first blog on this subject, we have noticed that many connections seemed to be missing, but we also flagged that this may be due to issues in mapping these, as well as real conditions where drains are simply not properly designed or not fully connected. Therefore, the drainage mapping team has extensively mapped observed begin points of drainage networks, outlets, and open ends of drains. Our data quality assurance tools are used to check whether drains are connected to at least one begin point and at least one endpoint. End points can be either a dead end, an outlet to a larger water body, or flow towards a neighboring ward, if this ward has not been mapped yet. Below you can find the result so far over the 20 wards currently mapped. Through a radio button you can see both connections to begin and end points. Nearly all drains appear green, meaning that mapping of the appearance of upstream and downstream ends is very complete (red means there is no mapped connection, and a revisit is still necessary). The map also shows the mapped begin and end points with colored dots. All the purple dots are places where the drainage network simply ends in nothing. We argue that these places may be risky places, especially when a large upstream drainage network flows towards them.

In conclusion: Ramani Huria is underway to produce the most complete and accurate drainage map of Dar es Salaam. Our prospect is that we can start building the most accurate and detailed drainage model to understand flooding, its impacts, and attribution of limited infrastructure, maintenance, and solid waste on flood risks. The one missing link is elevation data. Essential steps to generate this within Ramani Huria are underway. Please check out this blog for more information.

Interactive map showing connectivity of drainage features to begin points and end points. You can zoom in and out to inspect details.

Categories
Uncategorized

Mapping for EBOLA in DRC Congo: Creating spatial data sets to help responders in the field

“These people have never been mapped, nobody has ever cared enough about them to even know where their house is. So these houses that you have been tracing today, is the first time that anyone has ever cared enough about those people in that distant part of the Congo enough to know where they live and put them on the map. To be on the map is to be acknowledged, it is to be known, it is to be recognized, it is to be counted. It is for the world to know that you are there and that you have needs, that you have dignity, that you have rights, and you have given that to 150,000 people today.” – Ivan Gayton

On 9th June Ramani Huria prepared a mapathon aiming to trace roads and buildings to help the heroes fighting Ebola on the ground in the Democratic Republic of the Congo (DRC).

How can maps really help the fight?

During the 2014 Ebola outbreak in West Africa, which killed over 12,000 people, digital mapping became increasingly important in helping emergency managers with their humanitarian emergency response operations.

When considering the best tools and skills to respond to the Ebola crisis in West Africa, in 2014, Doctors without Borders/Médecins Sans Frontières (MSF) sent a dedicated Geographic Information Systems (GIS) officer to Guinea to support the local and international medical teams who were fighting the Ebola-outbreak. The objective of this deployment was to find out whether input from a GIS specialist was useful during a crisis. The MSF GIS Unit asked Ebola facilitator Timo Luege to write a case study showing the impact of this field-based GIS officer. Some of the key findings were;

  • Despite working in a very remote area, the GIS officer had adequate internet connection which allowed him to reach out for remote support. Among other things this made it possible for volunteers from the OpenStreetMap (OSM) community to contribute directly to supporting the response. This case shows how crowdsourcing can contribute to humanitarian emergency response such as epidemics.
  • The GIS Officer in the field, along with local staff, was able to provide context to the base maps that were produced remotely. Both the remote and field components were important – without remote support to produce sufficient OSM basemaps, the GIS team on the ground wouldn’t have had a baseline to upon which to build out granular GIS data (e.g. health facility locations) needed to respond effectively to the crisis. 

Remote mappers digitising roads and buildings in DRC using the HOT Tasking Manager

This historical case study inspired Ramani Huria to support the current Ebola crisis in DRC. The team decided to host a mapathon to map villages that are affected by Ebola or at-risk in DRC by tracing building and roads which will then provide a basemap to GIS analysts in the field who are vital in helping humanitarian and development organizations working in the area.

HOT Tanzania Country Manager, Ivan Gayton, also shared his experience of the Ebola outbreak in Sierra Leone which he witnessed during the deadly epidemic in West Africa as MSF staff. He explained to mapathon participants the incredible work of health professionals and responders working on the ground and how maps can support their work in tackling Ebola and other epidemics. As trade has increased in rural Africa, the rate at which diseases such as Ebola can spread has increased dramatically. Responders on the ground are tasked with contact tracing patients and vaccinating and isolating those they believe have been exposed in order to prevent the spread of the disease. Without adequate basemaps, medical professional face the next to impossible task of tracking the locations of those who have been exposed to Ebola. Supporting via remote mapping helps people trying to manage the Ebola outbreak on the ground to do contact tracing by providing a quicker way for them to locate the villages Ebola is coming from and stop the outbreak. 

A total of 75 mappers, and 94 participants, attended the mapathon and within two hours had added 37,583 buildings to the map. This is the equivalent of adding approximately 187,915 people to the map, making it easier for responders to locate and track patients and provide humanitarian support to save lives.

Group Photo of Volunteers at the Mapathon

We hope that responders in the field will use the data set created by Ramani Huria as a basemap to help them lead the fight on the ground. Ramani Huria team will always be willing to provide remote support to those heroes in the field.

Useful links:

Categories
Uncategorized

Using Cheap and Practical Devices to Measure Elevation

Ramani Huria and The World Bank are trying to figure out the best way to calculate elevation in Dar es Salaam so that it can be integrated into the flood model that is currently underway. Measuring elevation requires a series of complicated measurements. 

At the end of April 2018, three Civil Engineering students from Delft University of Technology in the Netherlands – Huck, Detmar and Martijn – arrived in Dar es Salaam to build cheap and practical devices to measure elevation. They will be spending two months in Dar es Salaam to work with Ramani Huria, a community mapping project. They believe the RH team is a very motivated team of young people that  can make community mapping a real and usable source of open data, and they have realised how important and difficult it is to have an accurate and up to date map of such a fast growing city.

Their project objective is to generate elevation readings which are as accurate as possible using temperature and barometric pressure. They will do so using an arduino combined with a Bosch BMP280 inside a watertight box. The goal is to cancel out the noise and errors from the sensors to get an accurate and usable elevation reading to implement and integrate into OpenStreetMap. 

This is the first time that they have worked with the BMP sensors so it is a new experience for them to trial how these sensors react within an urban environment. If they succeed in doing this, it will be possible to create an accurate elevation model of a big city using very cheap utensils. 

The ultimate goal of Ramani Huria is to accurately be able to measure elevation so as to produce the city flood model using cheap methods and being able to replicate this process in other cities of Africa if they’re need it.

On the 24th May, the results of the arduino experiments to date were shared at the Humanitarian Development Innovation Fund Innovation Week at Buni Hub.  

Workshop Breakout Session

From experiments so far, many of the environmental noises such as sun, wind and rain have been inspected and can now be taken into account. The absolute error of each sensor is now known and can be calibrated to one point, which has to happen every time a measurement is taken. More time will be needed to fully understand the relative error, but there are now even more filters that have been discovered to minimize this error. In the upcoming weeks the Ramani Huria team, led by the students from Delft, will begin field experiments using an android app which is able to read the arduino and sensor. The app already consists of a IIR filter (infinite impulse response) which filters the measurements to make the data more workable. The next task will be a server that collects all the data of those phones to a platform so these can be used easily and can be looked into at any time of the measurement. Every day, the potential for cheap, locally made devices to determine accurate elevation levels increases. These measurements will contribute to more accurate flood models and mitigation plans.  

Categories
Uncategorized

Innovation Week 2018 – BUNI Hub COSTECH

On  May 24th 2018, the Ramani Huria team participated in the Humanitarian Development Innovation Fund’s (HDIF) Innovation Week exhibition at BUNI Hub Tanzania. The aim for this engagement was to showcase how innovation has helped Ramani Huria to conduct mapping activities in a more precise way,with minimal costs. The Ramani Huria philosophy, “local people, local tools, open knowledge”, encapsulates the power of innovation to equip local people with the information needed to transform their communities. 

The innovations of Ramani Huria that were showcased at the event included: community mapping methods and the discovery of Shina boundaries (ten cell administrative boundaries), local quad drone development, drainage mapping using ODK, and measuring elevation using arduinos and barometers.

Community Mapping

During its kick off in 2015, Ramani Huria worked with Ward and Subward leaders together with university students to collect data in local districts, but it was discovered that the community did not feel comfortable responding to third parties when it comes to sensitive information. For the second phase of Ramani Huria, RH 2.0, the team started to coordinnate with hyperlocal leaders called ‘Wajumbe’, who work at the most granular level of administration system that exists in Tanzania. These leaders are responsible for small portions of the Subward and the community knows them well. RH 2.0 trained Wajumbe and community members to collect information in their own neighbourhood by using their own smartphone devices.

This method helped to collect an enormous amount of data in a shorter period of time when compared to RH 1. We call this “innovation” because this is the first time that the country has been mapped in a such detail by local community members themselves using their own devices. During breakout sessions at the exhibition, participants were amazed to see a flood map that was produced using data collected by community members themselves – the data is normally very reliable as they understand the neighborhood better than anyone else.    

Photo; Community mapping supervisor, Asha Mustapher, leads a round table discussion showcasing flood maps that have been produced through citizen generated data

Using OpenDataKit to collect drainage data

ODK is a famous application forin data collection, especially in the humanitarian field, but it has never been used for drain mapping but Ramani Huria has made this possible. Originally, ODK was designed to collect data points and not line features. The Ramani Huria team, however, made some improvements on the program to enable it to collect line trace features.. Read the blog about building open tools to map drains here.

Photos; The Ramani Huria team demonstrating drainage data that has been collected using local people and local tools. These drainage maps will help inform flood prevention plans

Using Arduinos and Barometers to measure elevation

Measuring elevation is very difficult and thus requires an established base of devices to make sure that the accuracy is high. Students from the University of Technology of Delft in the Netherlands are working on building tools to measure elevation. So far, a lot of progress has been made towards understanding how to accurately measure elevation which will ultimately increase the precision of current flood models.

Many environmental noises, such as sun, wind, and rain, have been inspected and can now be taken into account. The absolute error of each sensor is now known and can be calibrated to one point, which has to happen every time a measurement is taken. At Innovation Week, the team explained that the relative error needs more time to be fully understood and taken care of, but they are now discovering more filters which work and can be used to minimize this error. In upcoming weeks, the Ramani Huria team, led by the students from Delft, will begin field experiments using an android app which is able to read the arduino and the sensor. The app already consists of a IIR filter (infinite impulse response) which filters the measurements to make the data more workable. The next task will be the adoption of a server that collects all the data of those phones to a platform so these can be used easily and can be looked into at any time of the measurement. Participants in the workshop were impressed by the potential for cheap, locally made devices to determine accurate elevation levels and contribute to more accurate flood models and subsequent mitigation measures.   

Photos; Students from Delft University in the Netherlands and the Ramani Huria team explain how arduinos and barometers can be used to measure air pressure to calculate elevation

Drone development

This year, the Ramani Huria team developed a quadcopter drone – constructed locally by our own Tanzanian staff with the vision of collecting updated, clear imagery taken at low altitudes with higher resolution. This imagery will be useful in creating updated maps that can be used to plan for city flood resilience – an innovative approach tohelping community development.

Photos; Workshop discussions from HOT Tanzania’s Innovation Officer, Bornlove O. Ntikha, explaining the drone construction model and flood use cases 

Changing Perceptions through Innovation

Innovative tools used by local people using local knowledge have the power to increase civic engagement and empower communities to create impactful change within their own society. This has been proven through Ramani Huria, as the team has managed to collect precise flood data with the help of community members. We urge development partners to see the opportunity that arises from the community-driven data collection methods that we are using, in order to minimise the costs of running projects and increase impact by collecting first hand information from community members themselves.

Categories
Workshop

Impact of Ramani Huria showcased in a four-day workshop

From the 23rd to the 27th of April, Ramani Huria 2.0 organised a four-day workshop that convened critical stakeholders to engage in discussion on the progress and potential of community mapping methods in Dar es Salaam. 

Participants

The workshop was participated by university staff, government officials, ward leaders – including wajumbe, and community members. Participants were from departments or institutions that are directly or indirectly engaged with flooding. 

PHOTO; Presentation Session

Presentations

Participants were first introduced to OpenStreetMap – a free editable map of the whole world where anyone can view and upload/download spatial data. They also learnt about OpenDataKit Collect (ODK) – a free Android application that we use to collect information in the field mainly data points and line trace for the case of drains.

Drain Mapping Presentation.

A Hydrological consultant from Deltares in the Netherlands, Hessel Winsemius, who is developing a flood model of Dar es Salaam based on the drainage data that Ramani Huria is collecting, presented the work that he has done up to now.  Participants were really interested to see how the data produced through local methods could actually generate a sophisticated flood model for Dar es Salaam. See the previous post here on using open source tools to map drains.

Participants then witnessed a demonstration on drainage mapping. The Ramani Huria team took participants to the field around COICT grounds to see first-hand the methods that Ramani Huria uses to map drains and produce quality data.

During this experience, participants were genuinely interested in learning about Ramani Huria and expressed interest in becoming more involved in the project. The participants were also amazed that the data collected is entirely open so that anyone can download and use it for free. 

“We intend to use this data to identify high-risk areas and see how we can design better infrastructure. I was impressed to see how the flood model of Dar Es Salaam is produced by using Ramani Huria data. I think I will contact the developer of the model to learn more”.  Aidan  Mhonda- Assistant Lecturer, Ardhi University

QGIS Training

Participants were then introduced to open and free software that can be used for mapping. We installed QGIS software onto attendee’s computer and made sure that they all knew how to add shapefiles, change styles, categorise and duplicate layers of the map. The aim of this exercise was to offer a general introduction to all and encourage those who are interested to learn more about it. 

“The workshop has added value to my daily activities, for example using QGIS to produce maps in just five minutes in contrast to the programme that I was using which takes up to 30 minutes to compose a map. With QGIS plugins it’s much easier” Haroun Bakari Commission of Science and Technology (COSTECH) representative.

Some participant did not believe that flood maps can be produced, they come to realise it during the workshop.

“It’s interesting to see people mapping for floods, it’s not often mapped by many professionals. I’ve seen fantastic Ramani Huria Atlases and I am amazed how Ramani Huria can blend new technologies with a community participatory approach. Seeing the use of multiple layers of data and being able to establish trends that helps us to study flood-prone areas that are freely available to anyone is very interesting. Now I know that there is good data out there which I can use for different purposes” he continued.

ODK Form Building 

Participants were trained on how to create ODK forms using XLS. This exercise was facilitated through an in a participatory format – community members were asked to write down on sticky notes what problems they faced in their daily activities that they thought Ramani Huria could help to solve. From participant responses, one was chosen as a case study to build an ODK form together with the attendees. 

“When I first heard about the workshop I was really happy that I could get to know more about Ramani Huria. Apart from the Drain Modelling the most interesting part to me was ODK form building, and I will apply this knowledge to my students at the university for them to use ODK during their fieldwork data collection for their dissertations. My point here is not for students to simply collect data but to be able to analyse and use this data for decision making such as using data to design housing development projects”. Aidan  Mhonda- Assistant Lecturer, Ardhi University.

Using OsmAnd Application and Map Reading

Community members and Wajumbe (local leaders) received training on how to read maps and how to use the OsmAnd OsmAnd (a map and navigation app for Android and iOS. It uses the OpenStreetMap map database for its primary displays, but is an independent app and not endorsed by the OpenStreetMap Foundation). They were impressed to see maps of their own ward that they took part in producing via the Android application. Community members were able to locate their areas of residence on a map and navigate their routes to work.

PHOTO; Community Members reading a map during the workshop.

General Discussion on Stakeholders Involvement

There was a general discussion on stakeholders involvement and how we can involve these actors to improve impact on communities that are suffering from floods. The conversations were based around open (free) data and how the government could be further encouraged to provide support to initiatives, like Ramani Huria, that enhance community resilience from a ground-up approach.

The  discussion was based on three major questions

  • Why should we collaborate with you? 
  • Why should you collaborate with us?
  • How can we collaborate?

Eight institutions were willing to fully collaborate with the Ramani Huria project. These include Municipal Councils, the National Bureau of Statistics (NBS), the Energy and Water Utility Regulatory Authority (EWURA), the Ministry of Health, the Ministry of Water, educational institutions, Tanzania Petroleum Development Corporation (TPDC), and Tanzania Rural and Urban Road Agency (TARURA). 

Participants expressed their views on what they feel is most important to improve cooperation and collaboration with key stakeholders in order to ensure that the data produced through Ramani Huria reaches key users for greater impact.

‘’This is open data, open software- the world is now moving from confidential/ closed information to open data, let’s accept this and collaborate’’- Engineer Natt- Former city director of Dar es Salaam. ‘’I argue that government officials should collaborate and community members take part in data collection- we can not do this without community members’’, He added.

‘’The government do not restrict to collaborate, there are different ways to involve them. The simplest way is showing them what you have done (as Ramani Huria is doing) then ask for their opinion and include the suggestions in what you are doing. This is the simplest and collaborative way’’ William Christopher- Lecturer University of Dar Salaam.

As the main aim of the workshop was to increase collaboration with and involvement of more stakeholders in Ramani Huria, most attendees suggested involving key stakeholders during the data collection process in order to increase data use and sustainability of the project.

’You need to call us to do the work together not to show us what you have done. We are ready to collaborate with Ramani Huria‘’ – Grace Kiharusi- GIS expert Dar es Salaam city council.

At the end of the workshop, everyone was excited and willing to take part in the Ramani Huria initiative, networking with different actors. The event was a success!

Categories
Uncategorized

Community meetings- For Flood resilience plan

Photo; Community meeting.

On the 26th March 2018 the HOT Tanzania team conducted a pilot community meeting in Mbuyuni subward in Kigogo ward. The main objective of the meeting was to facilitate a discussion with different actors such as Mtaa Executive Officers  (MEO), Chairmen of the Subward, Councilors, Wajumbe leaders, Non Governmental Organizations and Community Based Organizations such as Tegemeo. Tegemeo provide education to the community on topics such as environmental education and how to support orphans – it operates nationwide.

During this meeting, community members pinpointed assets that they considered to be the most valuable within the Subwards and any possible threats to these assets perceived by the community. This information  allows Ramani Huria to produce a flood resilience plan. The maps will be the outputs produced after the information has been collected and organised using open source software.  

Photo- Ward Leaders reading maps to identify their residences.

Community meetings were conducted with different key actors in the subward. Attendees included; Mtaa Executive Officers (MEO), Subward Chairmen, Councilors Wajumbe, Ten cells Shina Leaders, NGO and CBO partners (such as Tegemeo Wajumbe), government officials, private sector organisations, and religious leaders. 

“I am happy to be part of this, Knowing what is being done in my ward, participating in identifying safe and unsafe areas on a map can be a good start toward better planning” Mazoea Ling’omba- Mjumbe, Kigogo Kat subward.

The meeting was participated by 43 members from the two subwards, with participatory community meetings conducted in groups of 5 to 6 members. The exercise began by training participants how to read the map by identifying main features in the Subward and locating their area of residence. By the end of the group discussions participants were able to locate their houses and update street names on the map where information was missing or incorrect.

Photo; Maps are being updated by adding the missing information, risk areas are being identified  with the important asses in the ward. 

“I am proud to be part of this process – I have been trained  on how to read maps, and putting important things on a map to improve information for flood reduction” Miraji Simba- Red Cross Coordinator.

The most important lesson learnt from the workshop meeting is that it is the community members who are the key people needed to create a resilience plan. They are the ones who can identify historical flood trends and the location of key risk areas. (ie an engineer may be able to pinpoint flood risk areas based on calculations, but cannot provide the scope, history and impact of the flooding)- The information provided by community members allows a more accurate impression of the trend of flooding to be created with better understanding of how flood events have evolved over time.

Community members and Ward leaders were more reassured and excited about the project when they understood that the flood resilience plan was not intended to relocate people from their residence but rather to build a better plan on how to reduce flooding and suffering related to flooding.

“Initially my neighbour and I were a little worried that our houses may be demolished, but now we are at peace because the project was well explained to us. I will go and explain to ‘my people’ in the Shina to reassure them that the project is based on planning for resilience” Mjumbe- (Anonymous).

In these two Subwards the main flood problems identified by community members were similar because the overall Ward is located between two major rivers, Msimbazi River and Kibangu River, that are ‘famous’ for causing flooding. It is clear that if the plans for flood resilience focus on accommodating people’s suggestions on the major community assets at risk and historical flood prone areas – improved mitigation plans can be produced which will reduce the effects of flooding.

Categories
Uncategorized

Flood Mapping

Since 2015, Ramani Huria has been tackling the issue of flooding in Dar es Salaam to reduce flooding and encourage sustainable water resource management. Now in the second phase of the project, Ramani Huria 2.0 is focusing on mapping the most flood prone Wards of Dar Es Salaam, such as Kigogo and Hananasif Wards, to produce flood extent information which will later be used to inform decision making and flood mitigation plans. The Ramani Huria team begin the community mapping process by introducing themselves to the ward officers, explaining the project and providing an introductory letter addressed Subward officials. Next, the team are introduced to the Wajumbe local leaders who operate at the most granular level of administration system that exists in Dar es Salaam.

This week we visited the field team this week to see the amazing work that is being done by the team.We were excited to meet one of the community members who has been involved in mapping since 2015 when Ramani Huria 1.0 was implemented.

“I participated in Ramani Huria 1.0 when we were using field papers and GPS devices to move around to collect information. It was time consuming and you may have lost data during the process, but now that we’re using smartphones to collect data it’s quicker and you’re not likely to lose data in the process” – Hafidhi Hamza, Community Member


LEFT PHOTO; Interview with Community Mapper from Ramani Huria 1.0

RIGHT PHOTO; Drainage blockage caused by littering behind a resident’s house in Kigogo Ward

The data collected from Ramani Huria is helping inform decision makers at all levels of society on flood mitigation measures to tackle current pain points. Already, based on the printed maps produced from Ramani Huria 1.0, local people are establishing waste management initiatives to clean blocked drains and educate residents on the detrimental impact of littering. As population increases and the level of waste produced multiplies, maps such as those produced by the Ramani Huria team are imperative to raising awareness of flood causes, mitigation measures and response plans. The Ramani Huria team initially started to use OpenMapKit for data collection and mapped Hananasif ward and part of Kigogo ward. The team then realised that it is more difficult to analyse data collected in polygon format, especially when producing heat maps you need the data to be collected as points, so the team immediately switched to using Open Data Kit (ODK). ODK allows them to collect data points and fill out the survey to establish the trend of flooding in this particular ward.

The data collection process was conducted in the following manner –

Ten cell leaders (Wajumbe) would select a community member who owned a smartphone so that:

  1. The phone could be installed with Open Data Kit (ODK) Collect.
  2. They could make sure that the survey form is downloaded from the server; www.turkus.net (the survey is written in Swahili to avoid language barriers and is user friendly).
  3. The GPS accuracy of the device could be checked (usually less than 4 meters).
  4. A community member could be trained by the Ramani Huria team on how to collect data using ODK
  5. ODK questions will be elaborated to community members to make sure they collect the desired information.

After making sure that community members are equipped with the data collection skills needed, field work commences. A community member is provided with scratch cards (to buy internet packages) and a power bank.


PHOTOS; Community member and Mjumbe conduct ODK flood extent surveys with local residents

[symple_testimonial by=”” fade_in=”false”] “Ramani Huria 2.0 is far better than RH1 because in this phase we conduct community surveys and a community member is asked questions such as if the residents of a particular house had experienced flooding or not. This can provide reliable and documented information to the government” – Hafidhi Hamza, Community Member[/symple_testimonial]

The field team then demonstrated how they analyse field data to make sure that everything has been covered before moving on to the next ward. Data is visualized according to Mjumbe leaders area of jurisdiction and within each cluster you can determine if all of the survey questions have been covered.

SCREENSHOT; Kigogo Ward Mjumbe data points visualized on a map – each colour cluster represents a Mjumbe Shina boundary

The team are also able to visualize clearly respondents answers to questions about the history of flooding in their area. Respondents are asked questions such as, “have you ever experienced flooding?”, “how deep was the flood water?”, “have you moved settlement because of flooding?”, “what do you think caused the flooding?”.

The team create a new dataset for each year flooding is reported so that flood impact can easily be visualized by year.

PHOTO; ODK survey form questioning the depth of flooding

Maps like the one above demonstrate clearly areas prone for flooding. Already, the impact of Ramani Huria 1.0 can be seen. Community members explained how the RH 1.0 maps have been used to inform community cleanup initiatives to remove waste from blocked drains. The addition of Mjumbe boundaries and more accurate, detailed flood data from ODK from Ramani Huria 2.0 will continue to inform and advise community members and government officials on focus areas for flood mitigation planning.

Categories
Uncategorized

Ardhi University Students and staffs trained on formalization of settlement

Localisation is currently underway to formalise the informal urban settlements of Dar es Salaam which currently comprise 70% of the city. Formalising a settlement is incremental in giving legitimacy to a community and in increasing the security of tenure of the residents and their land rights. Formalising settlements also allows for more detailed, sustainable city planning. Unfortunately, the current methods of data collection to understand these boundaries has resulted in inaccurate data and partial community engagement. 

To help improve current data collection methods needed for localisation, the HOT Tanzania team recently provided three days of training with 6 Masters students, all studying a Master of Science in Urban Planning and Management (Msc. UPM), and 3 members of staff at Ardhi University. Up until now, the method taken to map informal settlements has involved the use of drone and satellite imagery to identify resident boundaries. This process tends to be inaccurate and time consuming since local people are accustomed to the day to day 3D visualisation of their homes at street level, not a 2D drone image taken from above. The densely populated areas also make it almost impossible to identify individual houses and define boundaries. 

Prof Tumsifu Jonas Nkya(right), Dr John Lukenangula at Ardhi University (left) installing and practising using Open Data Kit (ODK) during  training from Ramani Huria expert Iddy Chazua (middle) 

Hoping to increase community participation and data accuracy, the HOT team have been teaching students and staff about open community mapping. The training involved workshops on using OpenStreetMap (OSM), JOSM, OpenDataKit (ODK), and OpenMapKit (OMK). Using these tools, digital surveys can collect data at street level by speaking with inhabitants to identify land-use, ownership and usage of buildings, and socio-economic status of inhabitants. Tagging building attribute on OpenMapKit whilst conducting the surveys at ground level ensures that land-use can be defined more accurately. This data can then be used to map out residency boundaries.  This method is quicker and more environmentally friendly than previous paper surveys since the additional data inputting stage is removed from the process. By involving community members directly in the mapping process in a format that they can relate to, more accurate data is collected. When community mapping begins, local Shina (division of a sub-ward) leaders, Wajumbe, will accompany the field data collection team to speak with local inhabitants to reassure them.

Training by practice led by Ivan Gayton, HOT Tanzania Country Manager.

The maps created from this project will be accessible to everyone online through OpenStreetMap. This means that for the first time, inhabitants of informal settlement will exist on a map and can be more included and involved in future plans for their city.  Printed maps will be used as Town Planning drawing which will study existing city conditions and land-use and consider where resources should be allocated or which areas are in need of development. The maps will also help monitor changes in building usage since, currently, government officials don’t have a referral point for building use if someone requests permission to change building function. 

Community Mapping can facilitate community participation by inhabitants mapping their properties and involving them in any other data collection which is crucial for the regularization activity” – Luteranya Mapambano Msc student in UPM 2017/18

Community Mapping is a key instrument in shortening time at site during regularization, since any person can find necessary information like development and any other main features without the necessity of going to the site” – Jikora, Emmanuel, UPM Student