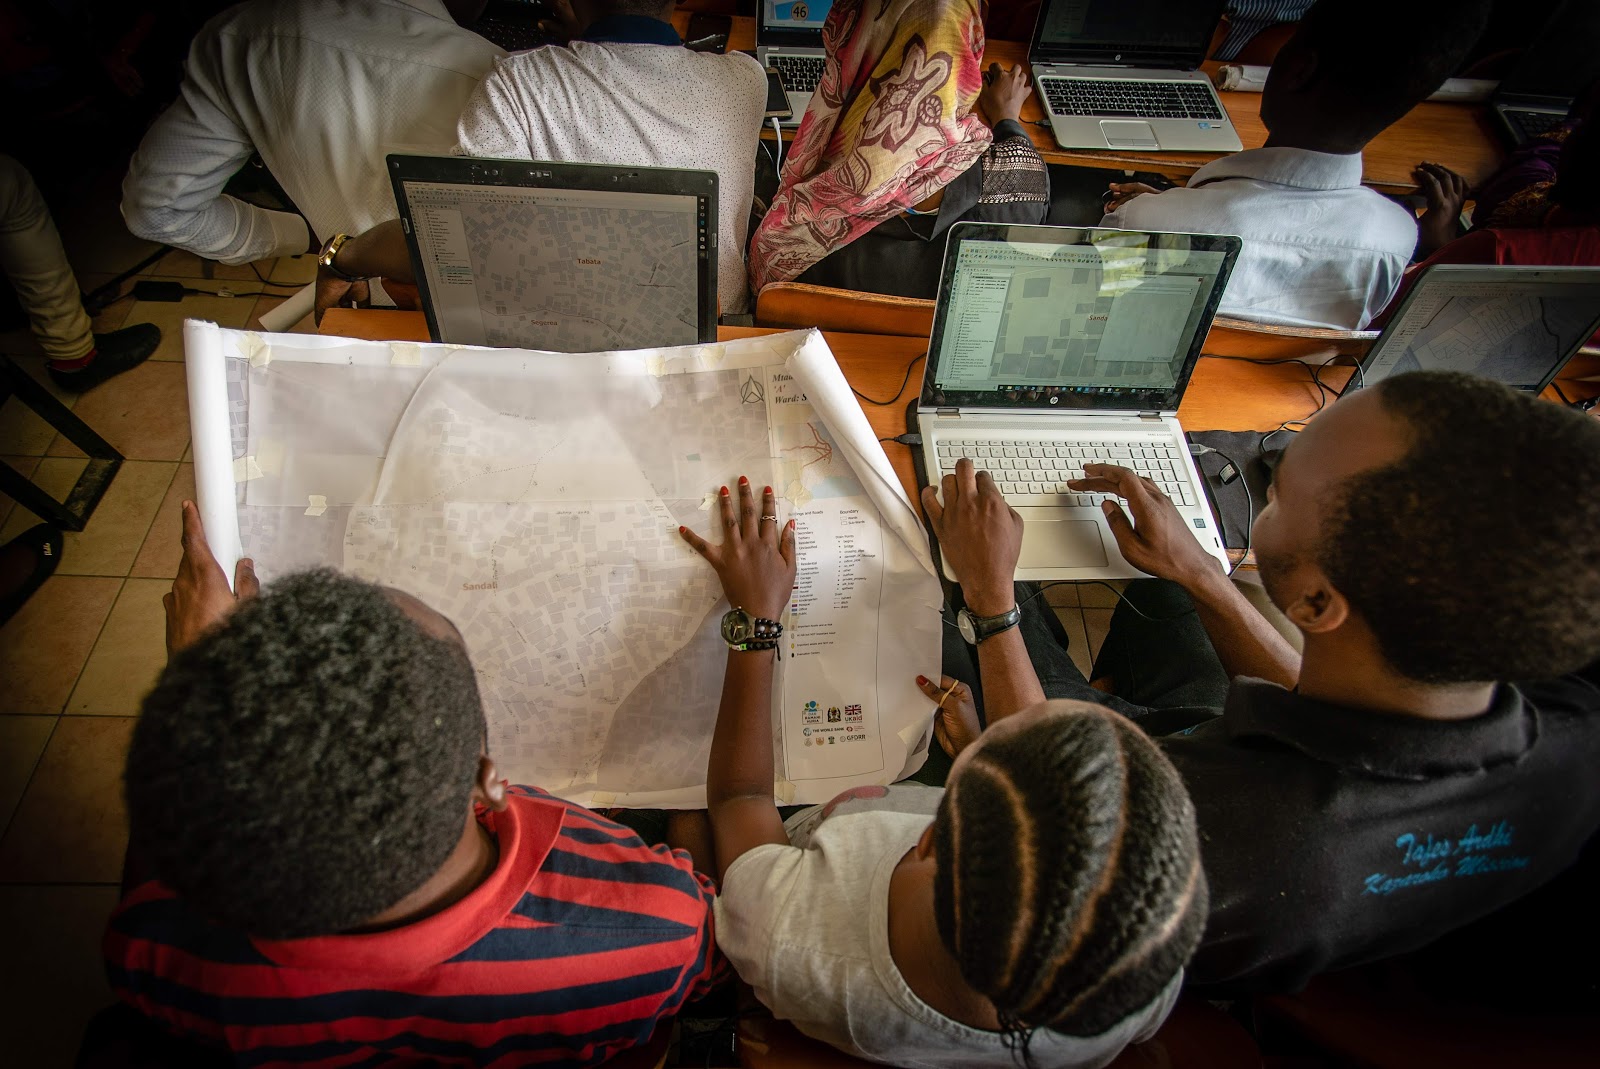
Community generated data has proven to be the most reliable information that reflects the community’s situation and the challenges they face. Working with community members to collect data in their own neighborhood increases data reliability, validity and its ultimate use as the community believes in the data and has a sense of ownership.
As we explained in one of our earlier posts Mwanza City is rapidly urbanizing with a lot of its growth concentrated in unplanned areas with approximately 81 percent of households situated in hazard-prone areas. Community knowledge was key to understanding the extent of these problems. For this reason, the consortium trained the students and communities on how to use cheap and widely available tools, such as mobile phones, GPS units, and satellite imagery to collect data on urban risks stemming from flooding and rockfalls.
Data Collected
Using a mixed-method approach consisting of digitizing the satellite imagery, mobile and GPS field data collection, community consultations, and stakeholder meetings, we were able to collect:
More than 300,000 buildings using satellite imagery
More than 15,000 points on flood-prone areas using mobile phones
More than 800 point on rockfall-prone areas using mobile phones
More than 80,000 points on urban exposure using mobile phones, and
At the moment of this writing 1700 drain segments with 145.013km
of drainage lines and 4300 drainage related points of interest have been mapped using a combination of mobile phones and DIY RTK units.
Areas at risk for rockfall
Insights from community members and leaders
Below are some of the quotes taken directly from community members and leaders who were directly involved in the process of data collection
“The data helps me as a community leader to represent the challenges with evidence to the higher authorities, I will especially like drainage data to be collected as it will show the real situation of the narrow drains in our subward.” Juma Kasudi, Mjumbe – Mwinuko subward
“The collected data will help in the warning system, enabling the communities to at least evacuate before flooding. We can also present the flooding issue to the district council as we have datasets that explain the whole situation. It’s now our duty as community leaders to educate our community that the data does not lead to house demolition or relocation but rather finding solutions”. Joseph Chui, Mjumbe – Kitangiri
“Kitangiri is one of the severely affected wards by floods and rockfalls. Schools are also affected, making me worried as a leader that one day students may get hurt or even die. I hope the data can reach the right actors and lead to the construction of permanent structures especially drainage systems”. Robert Charles, Chairman – Kitangiri A subward.
Outcomes of our engagement
Capacity building to 79 university students – final year students will use the same software in their research and dissertations as it has proved to be a more cost-effective way of gathering data
Requests from the university lecturers to teach more about open-source tools used in data collection
Raising awareness to community members and local leaders on the importance of data use in making decisions
Field data collection, Photo: Primoz Kovacic, Spatial Collective
Challenges during data collection
Nature of the terrain and accessibility; Mwanza is characterized by highly dissected steep slopes and rocky hills making it more difficult for mappers to collect data especially in the slums
Misinterpretation of the project; communities believed that the mapping will lead to the demolition of their houses and possible relocation. The mappers had to carefully and mindfully explain the goals of the project and that the project is not in any way connected to relocation
Political issues; the general election posed some challenges to obtaining permissions on time
What is next?
After the mapping and curation of all datasets, we expect to hold a workshop with the potential data users to ensure they have the ability to access and use these data for informed decision making. The workshop will involve key stakeholders like community leaders, road agency authorities, regional disaster departments, etc.
Community Mapping for Urban Risk in Mwanza, Tanzania
Photo: Primoz Kovacic
Mwanza is the second-largest city in Tanzania with a population of about 1.2 million. Located on the shores of Lake Victoria, it is characterized by highly dissected steep slopes, rock hills, narrow interfluves, and river valleys.
Like other towns in Tanzania, Mwanza has undergone a massive spatial expansion in recent years. According to Macrotrends, the population in Mwanza increased by 5.56 percent since 2019, with a lot of its growth concentrated in unplanned areas. Further, approximately 81 percent of households situated in hazard-prone areas fall in the low-income population bracket. These areas often lack access to adequate municipal services such as water, sanitation, solid waste, electricity, and drainage. These shortcomings, together with acute, periodic flooding, contribute to a deteriorating environment which often leads to an increase in health and safety risks.
Building on the previous projects of Ramani Huria and Zanzibar Mapping, Spatial Collective, Humanitarian OpenStreetMap Team, and OpenMap Development Tanzania recently extended their operations to Mwanza City. Under the banner of the Tanzania Urban Resilience Program (TURP), the aim of Community Mapping of Urban Risks in Mwanza is to produce high-quality, ground truth spatial information and urban risks data for selected wards in Ilemela and Nyamagana municipalities.
The consortium will achieve this by focusing on 4 core mapping campaigns:
By utilizing the rectified aerial and satellite imagery, we will produce digitized foot/roof prints of buildings as well as road and street networks suitable for OpenStreetMap.
Through drainage infrastructure and river mapping, we will produce datasets of critical drainage infrastructure including condition surveys of drains, culverts, and urban rivers.
Through the participatory mapping of unplanned communities, we will collect data on critical infrastructures, such as health facilities, access routes, government installations, safe spots, open spaces, businesses, schools, religious institutions, and any other relevant public amenity.
Through household flood and rockfall historical incidents mapping, we will collect and analyze data on flood and rockfall histories.
Flooding in Mwanza. Photo: Ester Daniel
All four mapping campaigns will be carried out in collaboration with the Institute of Rural Development Planning, St. Augustine University of Tanzania, and government officials in selected municipalities. Furthermore, the assignment will include training of government surveyors from the Ministry of Land’s lake zone office, Ilemela and Nyamangana municipal councils, Tanzania Rural, and Urban Road Authority (TARURA), and Lake Victoria Basin Water Board (LVBWB).
The project will both transfer knowledge on community mapping to stakeholders and provide authorities and communities with data to inform urban planning and hazard-preparedness in Mwanza city.
This blog is co-written by Spatial Collective and OpenMap Development Tanzania
Data for Waste Management: A Comparison between Formal and Informal Settlements in Dar es Salaam, Tanzania.
For the last 4 years, Ramani Huria – a project based in Dar es Salaam, Tanzania, led by Humanitarian OpenStreetMap Team (HOT) and supported by the World Bank – have mapped the drains, rivers, and other infrastructures across Dar es Salaam, to provide information for flood management. By mapping the city’s most flood-prone wards, we learnt that high urbanization and unplanned settlements have led to the mismanagement of waste materials, with negative knock-on effects.
Dar es Salaam produces an estimated 5,600 tonnes of waste per day, of which about 60% remains uncollected. Much of the waste then ends up in stormwater drains, which pollutes the runoff water, rivers and coastal waters and exacerbates annual floodingevents and the spread of diseases. To assess the extent of the problem, the Ramani Huria team conducted a pilot in two settlements in the city – one formal and one informal – to map clients’ locations and create a digital system of client tracking to support waste collection companies with their daily trash collection.
Ramani Huria partnered with two trash collection companies, Green WastePro Ltd. (operating in formal settlements in downtown) and Joshemi Company Ltd. (operating in informal settlements in Tabata Ward). By providing the companies with digital datasets they are now able to locate their clients and significantly improve the sanitary conditions of neighbourhoods as well as reducing the risk of flooding. We have reported earlier on the usability of this data on informal settings and published an article on how these datasets can tackle waste management in Dar es Salaam.
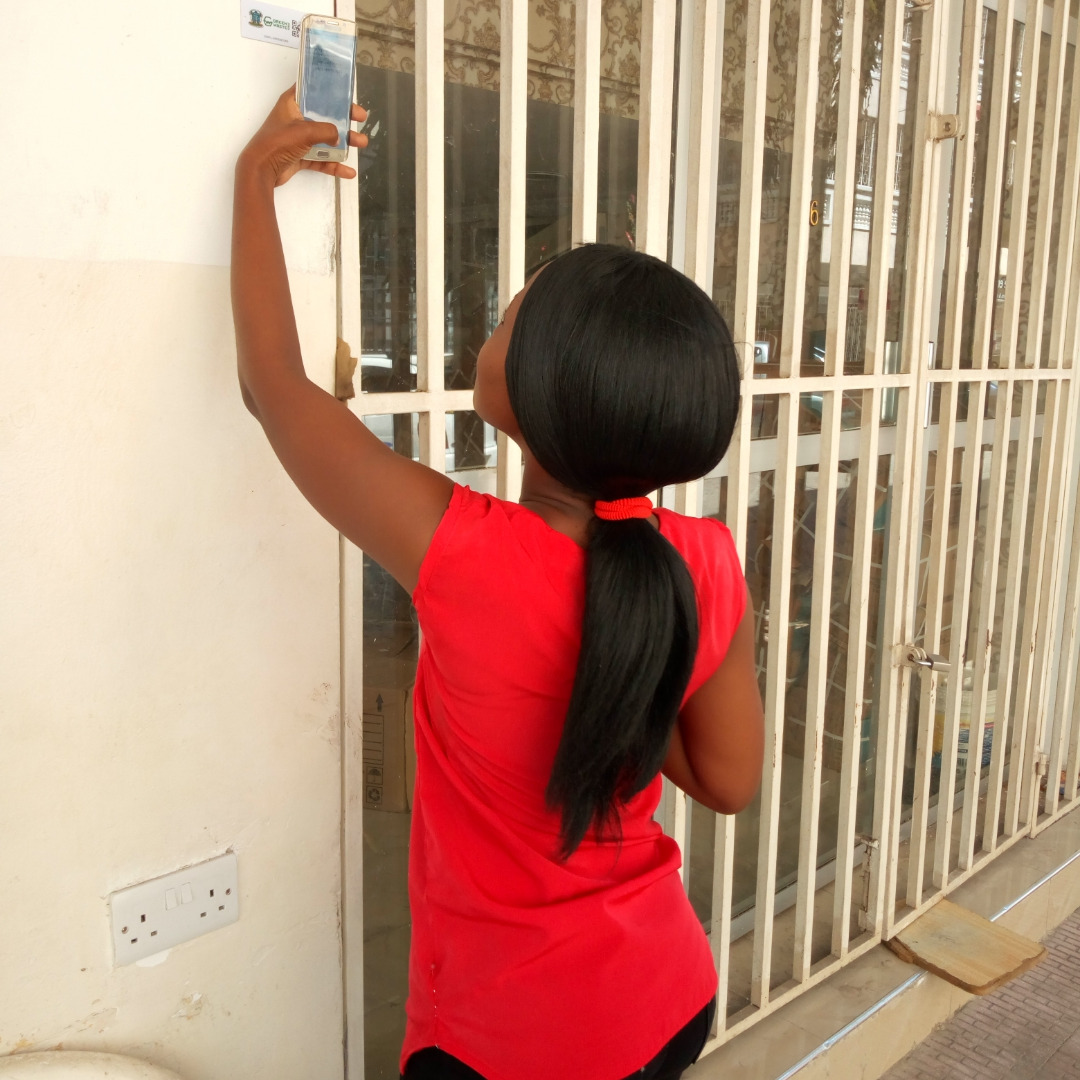
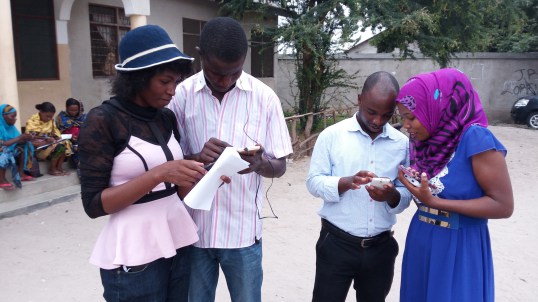
A mapper scanning a barcode when collecting clients location
As 70% of the city is made up of informal settlements, HOT decided to develop data on unplanned areas. Informal settlements in developing countries typically face severe environmental and health consequences due to ineffective household waste management, but by collecting comprehensive data on the location of the clients, the companies will be able to easily track them and improve waste collection services, hence reducing poor waste disposal and make Dar es Salaam more flood resilient.
With the project coming to an end, we thought we would take the opportunity to reflect on what the data for waste management has shown us and teach us about other growing cities in developing countries. Here are the four main things we have learnt:
Level of awareness
In formal areas, they have a higher level of exposure in the use of technology and technical abilities than informal areas. For example, in formal areas, clients have a unique barcode to identify them, whereas informal settings, our mappers had to assign unofficial ID numbers in order to support revenue collectors by making data collection easier because the ID numbers show the exact location of each client.
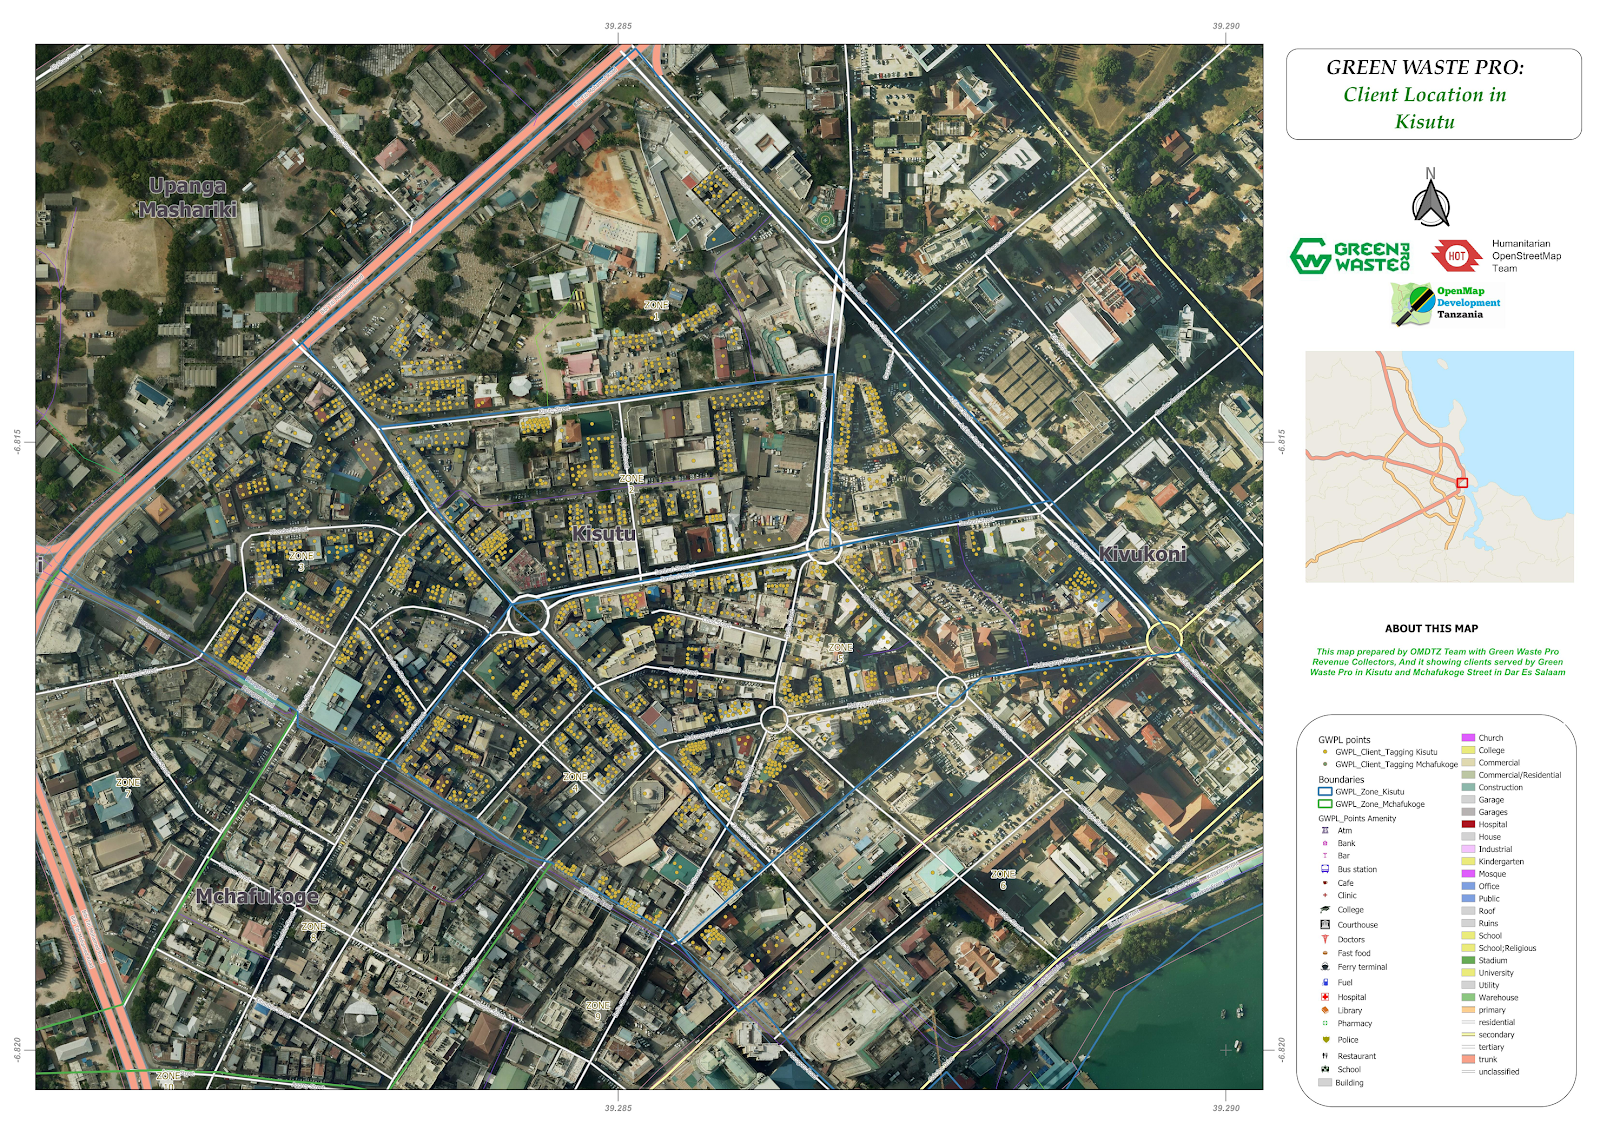
A client map developed on pilot wards of formal areas
Companies invest more in planned/formal areas than informal.
Previously, waste management companies mainly operated in formal areas. This may be because of perceived costs as customers in these areas are more likely to pay for the service. There are normally no individual waste collectors on formal areas compared to informal areas where there are many individual (informal) waste collectors, and this may be a reason for companies to invest more.
But as we discovered by collecting data, companies are missing out on revenue opportunities by not collecting in informal areas. In February 2018, HOT provided waste management companies with data that helped improve their collection services in two formal wards (Kisutu and Mchafukoge) which lead to a significant increase in the revenue of the company.
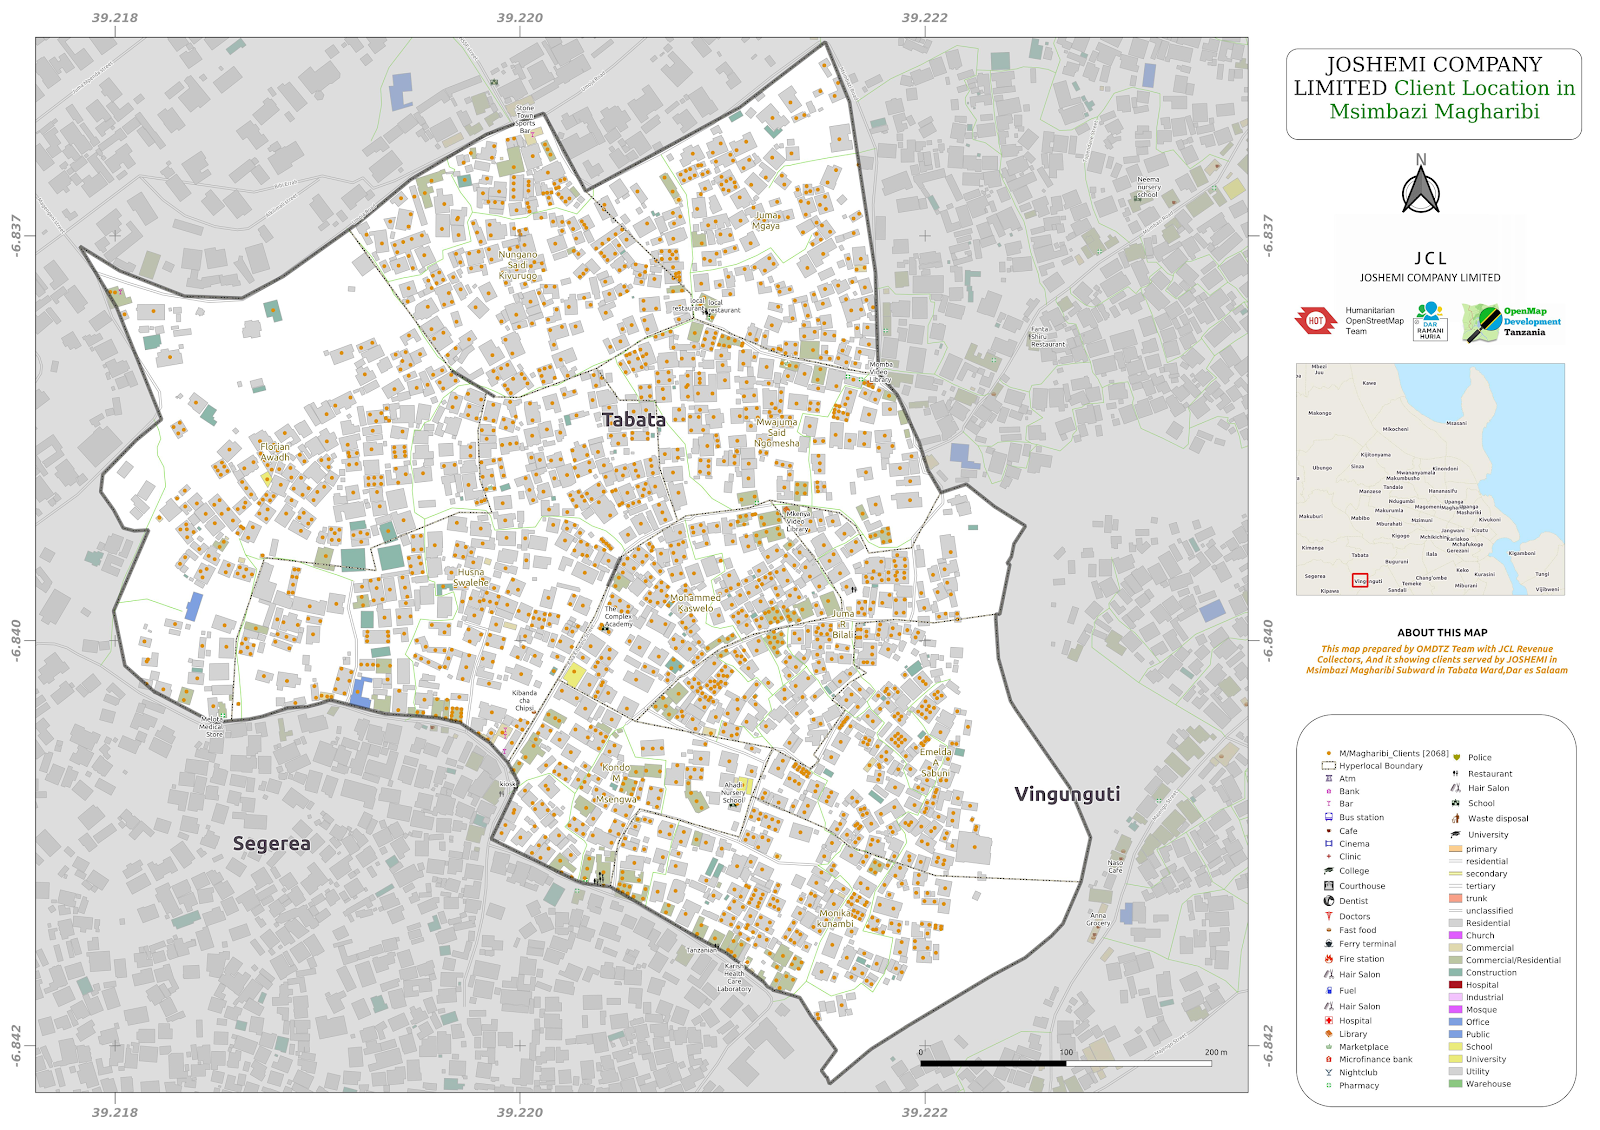
A client map developed for informal areas
Communities in informal settings are left behind when it comes to waste collection.
Communities in informal settings depend on individual waste collectors as most of the companies tend to collect trash from business owners that normally reside along roads. Inaccessibility, as most people don’t live on main roads and the smaller roads/tracks in the informal settlements, are hard to access, lack of information that clearly shows how many people need services and the location of potential customers that need companies’ services may be the reason for the low investment of companies on trash collection. By providing this information, it can help companies and authorities to make better decisions on waste collection, and in turn, making the city clean and reduce the risk of flooding caused by blockage of drainage systems.
There are also weak links to formal systems of waste management chains and neighbourhood responses to bridge these gaps, making them ineffective in localities where the needs for improved services are the most pressing. Data that HOT provided in Tabata Ward helped Joshemi Company Limited (JCL) locate and know the number of potential clients, although it is yet unclear if this has increased revenue.
Waste management systems are rarely described and analyzed from the perspective of communities in informal settings.
A more sophisticated system was developed for formal waste collection companies compared to the system developed in the informal setting. After the mapping a capacity building and daily support on map use from HOT team to support the company’s ability to use data. However, waste management systems are rarely described and analyzed from the perspective of how informality interacts (or not) with formal waste management systems, but the difference is huge yet bringing the same/similar outcome.
Dar es Salaam is one of the fastest-growing cities in Africa. The population is expected to grow so much, that Dar es Salaam is projected to be the second-largest city by population in the world by 2100, with a predicted population of 76 million, (according to World Population Review). The annual growth rate is expected to average 4.39% through the year 2020. In the next three years, the population is expected to reach 5 million.
With this rate of rapid urbanization and population increase with 70% of its people living in informal settlements, waste management (the solid waste in particular) is a serious problem. Concurrent with recent socio-economic development, the quantity of solid waste generated has increased at a rapid rate. There have been policies and laws to guide solid waste management in Dar es Salaam but it has never been effective, such that people tend to dump solid waste any way they can as there is no proper and effective way of waste collection
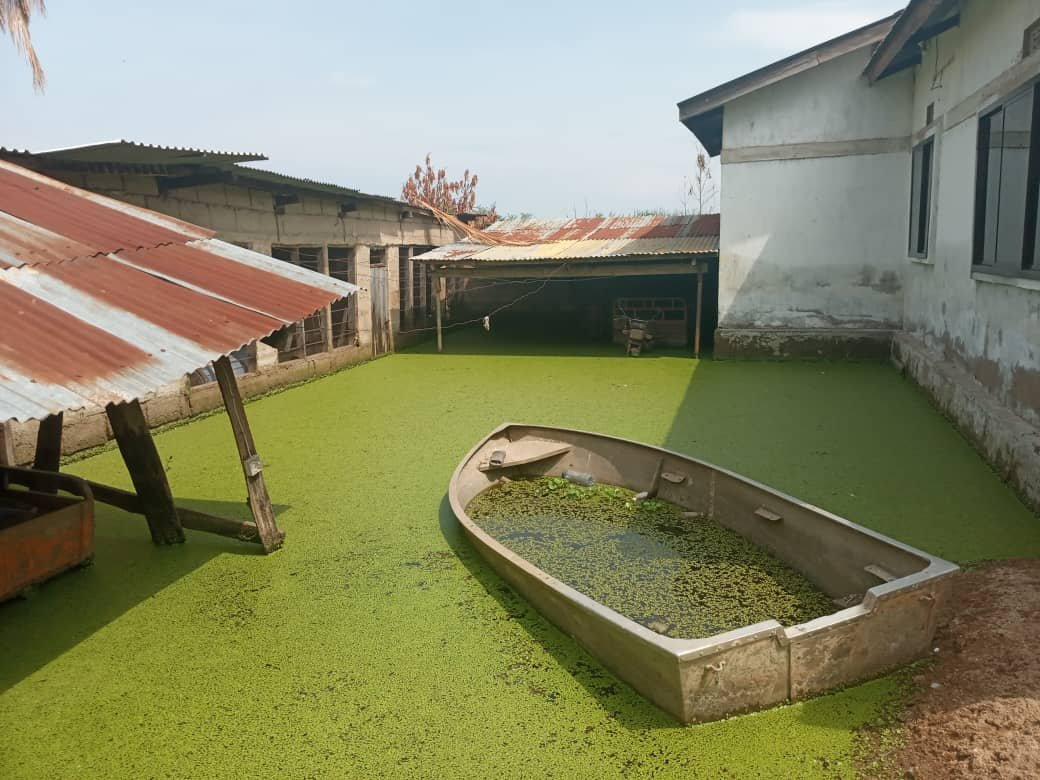
Flooding in Dar es Salaam is mainly caused by blockage of the waterways, i.e. rivers, drains, streams, ditches, etc. People dump solid waste and cause blockages. Materials like metal, plastics, and sometimes natural debris are being dumped causing flooding. Without proper and effective ways of managing waste, floods will continue to overwhelm the drainage system, overflowing into communities, In Tabata most houses are flooded due to blocked drains.
HOT, with their local partner OMDTZ and supported by the World Bank, decided to pilot a mapping activity in an informal settlement (Tabata Ward) similar to what they have done in formal areas (Mchafukoge and Kisutu wards) and create datasets that may help trash company collectors to effectively collect trash from their clients.
HOT and OMDTZ partnered with Joshemi Company Limited, a company dealing with trash collection in Tabata. Tabata is an administrative ward in the Ilala District. According to the 2002 census, the ward had a total population of 46,228. The ward is comprised of eight subwards [Mandela, Kisiwani, Tenge, Msimbazi Mama, Msimbazi Magharibi, Tabata, Matumbi and Mtambani]. It is mainly comprised of informal settlementsand is found along the Msimbazi River valley (the main flooding river in the city).
Joshemi Company has created a weekly schedule for every subward where they have to collect the solid waste. Residents and owners of business firms must pay a certain amount to the company depending on the size of the trash bag.
The Aim of Mapping
JCL needed to know the number of clients as it was very difficult to track them all, revenue flow and an effective feedback system on services provided by the company. The aim was shifting JCL’s analogue system of trash collection to a digital system by providing them with their own maps of clients’ locations and a system of tracking them. This way, JCL would improve their services to clients, increase their revenues and create an effective waste collection mechanism.
Methodology
Pilot mapping was conducted in two subwards of Tabata Ward (Msimbazi Magharibi and Msimbazi Mama). As our policy has always relied on open source software, we used OpenDataKit (ODK) Collect and OpenMapKit (OMK) – an extension of ODK which is a free and open android application for data collection. The team worked with revenue collectors to conduct mapping as they have a better understanding of the area to ease the process of data collection.
Field data collection. Msimbazi subward, Tabata.
The team prepared an excel sheet with ward, subward name, name of mjumbe, location together with client information including name, phone number, month, amount and receipt ID. To ease the process, fake ID numbers were created to identify clients’ houses because in informal settlements there are no house numbers. The sheet was then printed and given to the mappers for data collection, data cleaning and processing.
Fake house ID numbers are given to identify houses (The layers of buildings visualized on OMK application)
The team training JCL on how to use ODK and OMK in the field at Msimbazi Mama, Tabata
Outcomes and Impact
The company has a full understanding of the location and number of clients and challenges that their clients face. As the company now knows the number of clients, they plan to improve their services by having more trucks and more trips. Before mapping, they were only serving 300 clients, and after mapping, they have come to a realisation that there are 2000 clients that need to be provided with the service. This will not only increase the company’s revenue but also improve service to the citizens and keep the ward clean.
Johanes Petro, a mapping supervisor at OMDTZ is very positive about the initiative. He said,
“This initiative will lead to improved waste management as the company now knows they have many clients, they may double or triple services and the clients will be serviced accordingly. In turn, this will increase revenue to the company and improve services to citizens”. He added, “There is a need to replicate this process to all informal settlements in Dar es Salaam which will contribute to a sustainable and clean city as the system created is user-friendly”
Note:
Until now, our team is working with the revenue collectors to capacitate them on data use and help to establish the link between the excel sheet prepared and established layers of OMK.
Challenges in Data Collection
The team started the process of data collection with the revenue collectors, but the revenue collectors were a bit hesitant to provide full collaboration as they were fraudsters and printing counterfeit receipts. So they believed if the company is provided with reliable data and the exact number of clients under service, their stealing methods would be revealed. So they did not collaborate and the company fired them.
Mappers had to shift from working with revenue collectors to shina leaders, famously known as “wajumbe” – the hyper-local leaders (the most granular level of administration that exists in Tanzania). These leaders are responsible to administer a small cluster of houses ranging from 50 to 200 houses, and they are citizens’ primary point of contact. So working with them is an advantage as they are well known and trusted by the community
What is Next?
Seeing the positive outcomes on the two pilot subwards, there is a need to extend the project to the remaining six subwards of Tabata and even to the whole city if we had the support and funding from different partners. Joshemi Company that we’re working with are also eagerly waiting for the extension to the remaining subwards as they understand the power of data now- they even decided to pay community leaders and wajumbe that were helping mappers on data collection.
If this process is replicated in the remaining wards of the city, trash collection will be easier, the city will be clean and may also reduce the intensity of flooding as it is normally caused by blocked drains and rivers. There is also a need to develop an integrated solid management system which is cost-effective and that takes into account economic options for solid waste management like recycling. The community and the general public also need to take responsibility for the process by collaborating with waste collection companies because the benefits are reciprocal. Our mappers are working on solidifying relationships between clients and companies as there was observed drift among them.
Since its kick-off in 2015, the Ramani Huria Project has collected numerous amount of data to help mitigating and planning for flooding in Dar es Salaam. Data collected include historical flood extents data, drainage data, infrastructure – buildings, roads, drains, etc. We also conducted flood risk identification in more than 200 subwards of Dar es Salaam and mapped hyper-local boundaries of the city, famously and informally known as “shina boundaries”.
Having all these data was not sufficient to produce a flood model of the city. There was one missing component in the data which is soil characteristics of the city to help in the geomorphological assessment. The existing soil data was too generalized for the whole country which would be of help when trying to understand the nature of the soil of the city.
Ramani Huria partnered with JBA Consulting (specialized in understanding geomorphological features) all funded by the World Bank and worked on developing a surface soil dataset that will be used for geomorphological assessment and soil characteristics of Dar es Salaam in comparison with future flood risk studies in the region. Soil and/or sediments were sampled from Dar es Salaam and nearby districts that border the city because most of the sediments that flow to the city are from the upper catchment areas which are not likely to be within the city. In order to get a complete dataset of sediments form, these areas needed to be examined too.
Methodology
Our partner, JBA Consulting, created 731 sample points on a map using a 2km by 2km regular grid to make sure we get samples for the whole of the Dar es Salaam catchment area. A team of 12 field mappers was then trained in the data collection, with an offset policy in place for points where a sample could not be taken due to inaccessibility. Each sample site had its unique code to identify it, date of sample collection and the name of the mapper to avoid any inconvenience that might occur during the analysis.
In case the sample point was hard to reach or a sample could not be collected for some reasons like paved areas, the mapper had to move about 500 meters north and collect the sample. In order to reach the points for taking the soil samples, mappers were used MapHub on their phone to guide them. When connectivity became an issue the team switched to the Maps.Me application, which allowed them to navigate to points offline simply relying on the GPS on their phones.
731 points represented on Maps.Me Application and Map Hub Application How points are displayed in Maps. Me
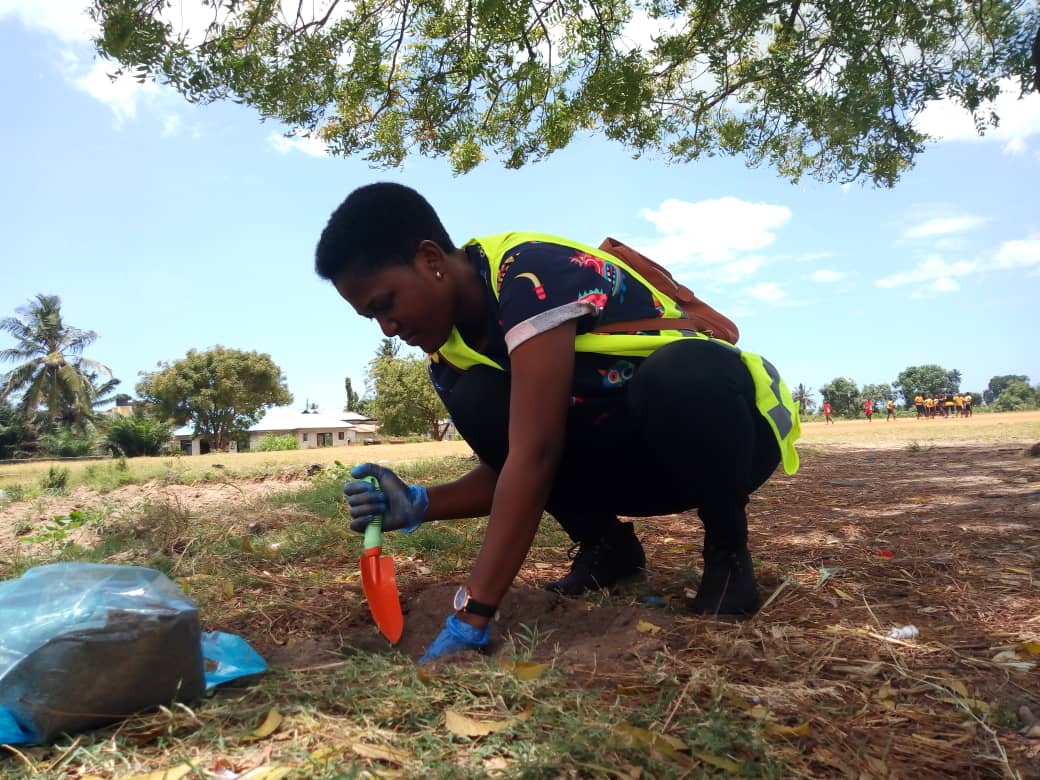
When collecting samples in the field, a mapper needed to take two samples; top sediment at the depth between 3cm -7cm and the bottom sample between 7cm -15cm. When in the field, a mapper would fill out an Open Data Kit survey form about the collected soil sample and take a picture of the surrounding environment.
A mapper in the field collecting a soil sample. Photo, Ramani Huria.
The ODK form had questions to be filled with mappers when they were at the site. The questions included:
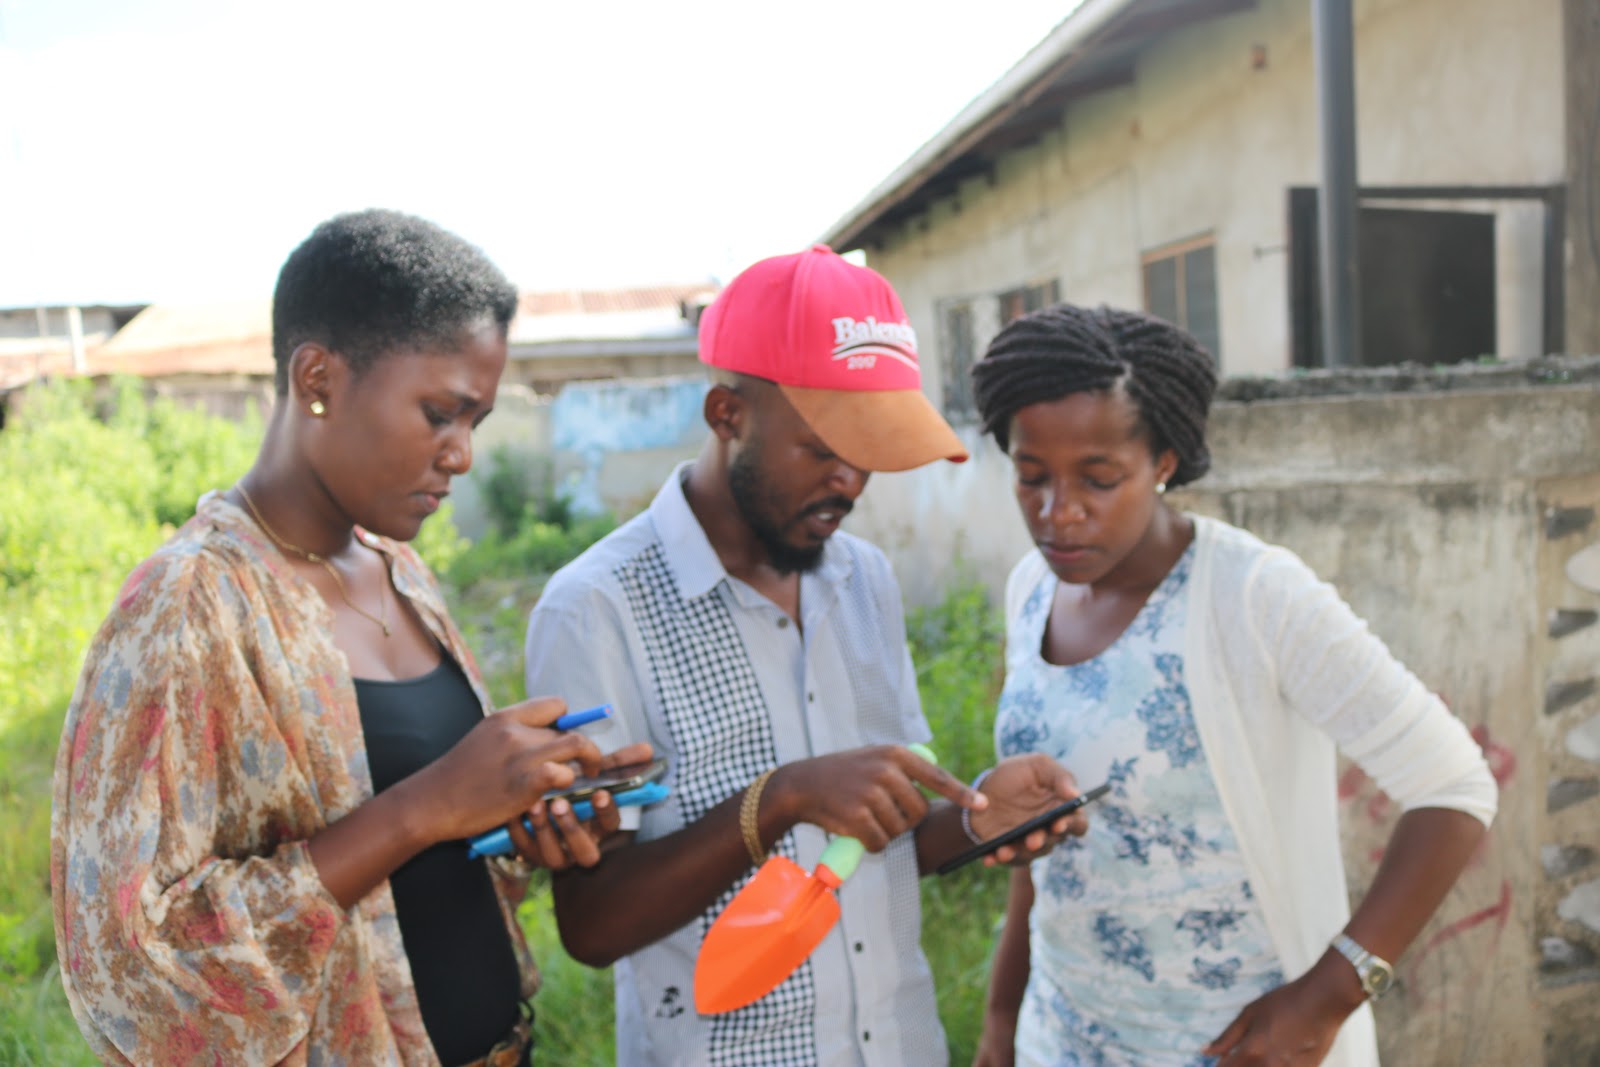
The name of the region where the sample was collected, district name, ward name, subward name, the ID number of the sample and also the mapper was supposed to take photos before, during, and after collecting the soil sample.
Filling out an ODK survey form about the sample after collecting it on the field. Photo, Ramani Huria.
Analysis of Sediments
The collected sediments were then sieved to determine grain size distribution. Before sieving, the sample is supposed to weigh 500g, and after sieving, the mass of the soil was recorded on a spreadsheet according to the layers of the sieving tool. There was also a prepared ODK form which was being used to fill in the sieved data to make sure that the data is safe in a server.
Outcomes and Impact
Now that we have soil data of the city and the drainage data is underway to be completed, we will then be able to create an accurate flood model of the city by layering the sediment data and drainage channels data of the city and obtain a more complete understanding of flooding in Dar es Salaam.
Apart from having data on soil characteristics on the city, Our team have learned a lot and increased their level of expertise as they fully participated in sample analysis which is normally done by professionals. The commitment of our team and eagerness to learn new thing is among the best outcome of this activity.
What is next on the RH 2.0 project? As the next phase of Ramani Huria 2.0 is expected to end in July this year, in the coming month we expect to go back to the community and share back the data that we have been collecting over the past months. A number of “shareback” sessions will be conducted and we will build the capacity of local leaders and NGOs on the specific subwards/ wards to make sure they are able to use data collected for different developmental activities.
2018 has been a year for floods. In March, excessive rains in East Africa killed nearly 500 people. In July, Japan saw heavy downpours which led to widespread devastation with more than 200 deaths. In August, another 300 people lost their lives in Kerala, India during the worst monsoon in nearly a century. And just this month, Typhoon Mangkhut has killed over a 100 in the Philippines while the east coast of the United States has witnessed unprecedented flooding as a result of Hurricane Florence.
In Tanzania, students from Ardhi University and the University of Dar es Salaam have completed the mapping of 228 subwards – identifying assets and threats to strengthen the understanding of climate risk at the local level, leading to greater flood resilience. Ramani Huria would not have been able to accomplish this without scaling up the project, working with well over 450 students for the past seven weeks.
To get an idea of the preparation for this work, check out our previous post here – but to get an inside look at how we conducted this year’s industrial training read on.
Summary of Seven Weeks
TRASH MAPPING
After orientation, Week 2 began with trash mapping to support a civic-led mass movement called Let’s Do It! World, whose goal is a clean and healthy planet. This was organized by their lead partner in Tanzania, Nipe Fagio, or “Give me the broom” in Swahili. The aim was to collect major trash points in Dar es Salaam. Students mapped 44 wards of the city by using OpenDataKit (ODK) – an Android application that we use to collect an enormous amount of data. In total, 20,392 trash points were mapped. It is never a good thing to have so many trash points in a city, but by mapping them in advance we are able to strategize the efforts during World Cleanup Day on 15th September.
Students mapping trash in Buguruni Ward. Photo credit: Chris Morgan/World Bank.
COMMUNITY ENGAGEMENT TRAINING
For Weeks 3-6 students engaged in the main part of this summer’s training: Community Asset and Threat Mapping. First, they received training on how to conduct meetings with community members and collecting data with their help. Then, students were trained on how to handle challenges and problems that may occur during their field operations, for instance, when political issues arise. What follows is the methodology that Ramani Huria used to conduct our data collection.
Methodology in Brief
Community meetings were held differently based on whether the subward was mapped or unmapped. There were 26 wards in Dar es Salaam that were mapped in detail during RH 1 in 2015, and 18 wards that were unmapped.
For the case of mapped subwards the exercise was a bit simpler because we already had data for them and printed a map on which community members identified assets and threats as well as any missing information. For the case of unmapped subwards, the task was a bit more complicated since it involved data collection of important features such as schools, hospitals, and open spaces on the specific wards, as well as cleaning that data. After this, students produced a map that community members then used as a base map in the community meeting to identify assets and threats on flooding, as well as missing information for students to recollect information so as to produce the final detailed map.
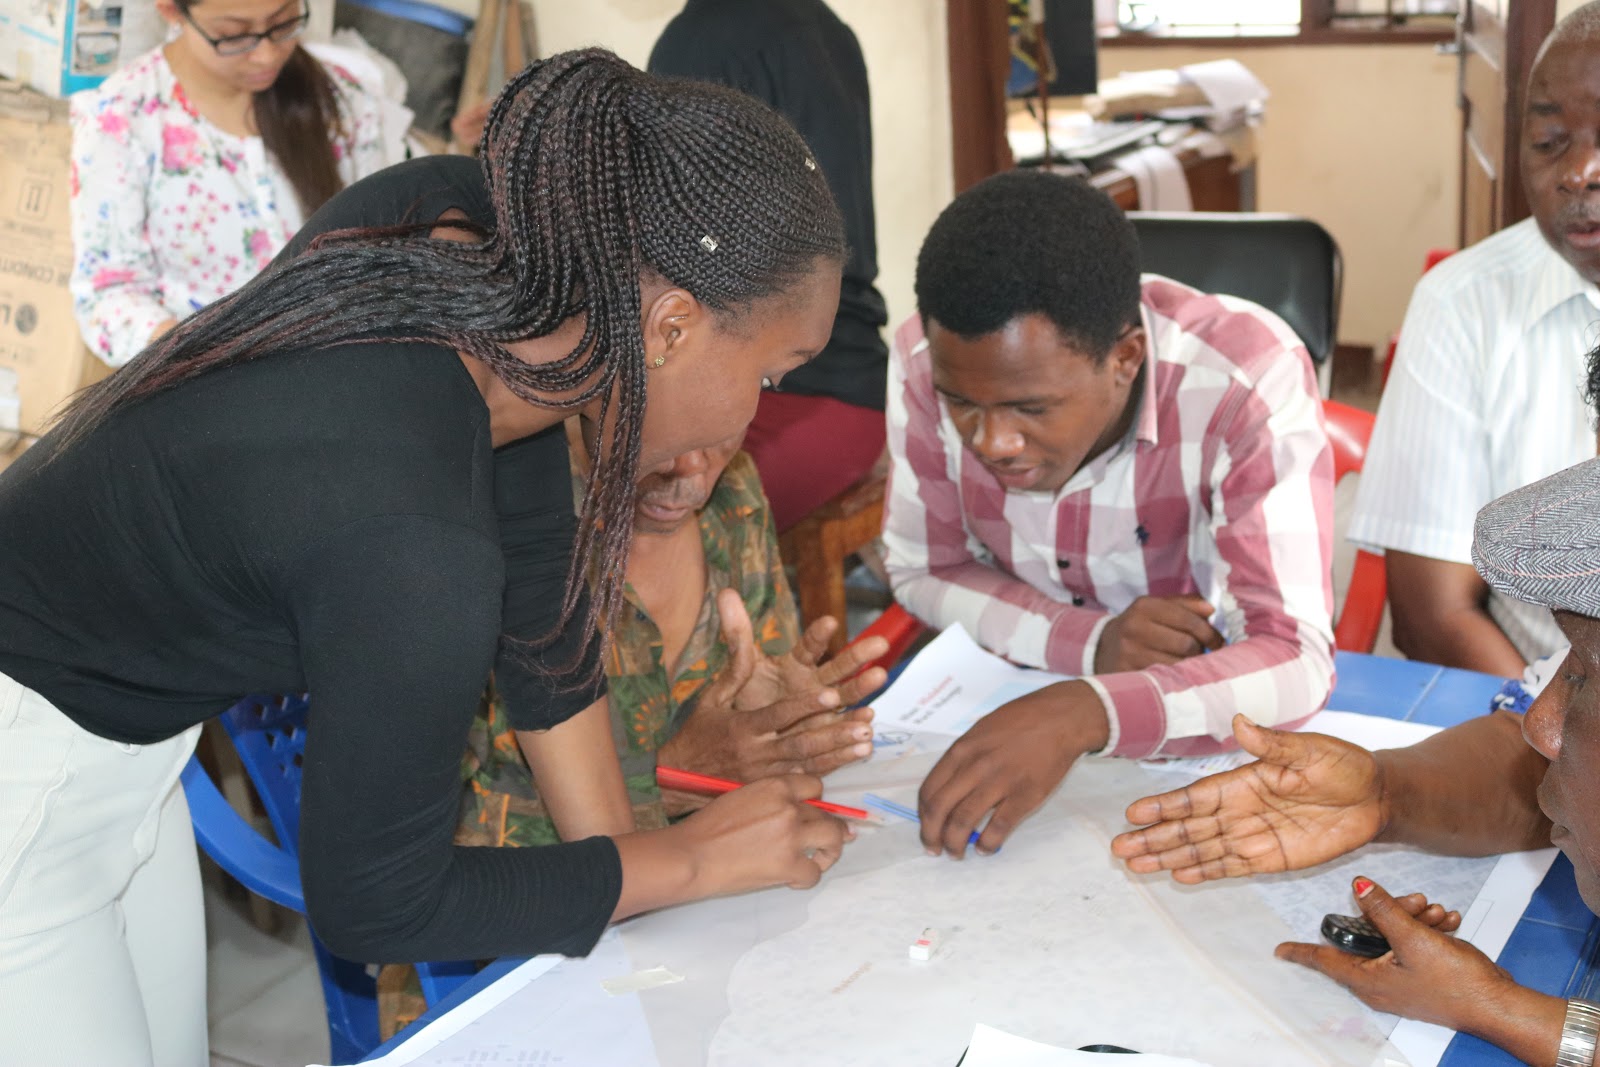
Community meeting in Mlalakuwa subward- in Makongo ward. Students are working together with community members who identify assets and threats in the subward. Photo credit: Godfrey Kassano/Ramani Huria.
Within the subward, students arranged a meeting of about eleven participants, including ward wajumbe (representatives), subward executive officer, religious leaders, local youth and elders, subward executive officer and community-based organization (CBOs). A group of six students led by a student team leader facilitated the meeting by:
Introducing the team and the project to make community members conversant with the type of information they are about to share.
Splitting participants into groups of three – each led by two students for group discussion.
Distributing printed maps and tracing papers to all groups for them to identify assets and threats in the subward.
Students in each group made sure they collected all relevant information by asking questions and keeping participants engaged. The process of creating three separate groups ensured redundancy, in order to catch all information.
Community Insights During Mapping
In conducting meetings, community members were excited about how engaging the project is. By involving them in all stages, from data collection to risk identification, it creates a sense of ownership and may increase data use as the community feels the data belongs to them.
“We are very excited since most of the organizations usually come to collect data without considering community members, they only include the local leaders to gather information. Thank you for considering us as the community members.”- Anonymous Community Member
Community members also suggest that feedback can be shared with them after data collection and analysis.
“Now that you have collected information from “my community” we will be happy to see the feedback of what you have obtained from your survey.” Paul Richard, Chairperson -Kilongawima subward, in Kunduchi ward.
Challenges in Management and Involvement with Community Members
Managing a large group of students and producing intended outputs was a challenge, but by keeping them engaged, and by understanding the clear objective of the project they felt responsible and part of real change. This was done by raising up students who are natural leaders to support their fellows during fieldwork, this made them feel comfortable working together.
Involving community members/leaders in mapping is an excellent objective, but some of them expected to earn more money from the project, even threatening to stop working with us if we do not pay the amount that they wanted. To counter this, students explained the benefits of the project, which led to a better understanding and we worked smoothly with community members. This was possible by making them understand how the collected information will help them in flood hazard planning and prevention since most of them have faced floods almost every year. They became cooperative and provided reliable information which will help in reducing flood hazards in their neighbourhood.
Data Produced
Two main deliverables from the process are reports and maps, produced for each subward. A report consists of information gathered from a community meeting, conducted with local residents and leaders about the assets and possible threats perceived by the community. The map includes annotations that correspond to the report to better describe the situation visually.
Students digitizing information obtained from community meetings in order to produce the final action map for a disaster management plan. Photo credit: Chris Morgan/World Bank.
In addition to the data collectors, students worked in two teams to specialize in data cleaning and map making, to ensure the highest quality deliverables. The reports and maps will be used for risk reduction as well as disaster management planning in the wards by Deltares – an independent institute that has expertise in flood risk management. Together with ward leaders they will sit and develop a disaster management plan. In our next post we hope to share a Community Asset and Threat Inventory, our team is currently working on finalizing this.
COMMUNITY-MAPPED ELEVATION THROUGH “DIFFERENTIAL BAROMETRY”
At the same time as the Community Asset and Threat Mapping, fifteen students from the College of Information and Communication Technology (COICT) – University of Dar es Salaam took part in a separate but related project about elevation and differential barometry. Understanding flood hazard and risk in complex urban water systems and vulnerable neighbourhoods requires accurate geospatial information.
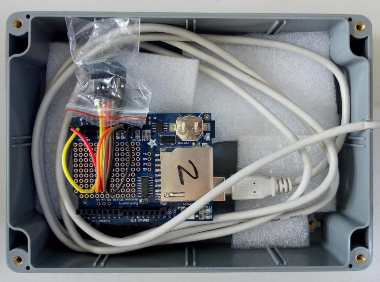
Obtaining elevation of surveyed areas is costly and technical knowledge is a must. This project tackles the two issues by using an Android application and cheap electronic devices: Arduino Uno and BMP280 (Barometric sensor). Any member of the community with a knowledge of using a smartphone can take part in mapping elevation of their neighbourhood with Differential Altimetry (Android app). For a period of 8 weeks, students assembled units (shown in the picture below) and carried out experiments in various locations around Ardhi University campus.
A device used to measure elevation using barometric pressure.
NEXT STEPS: SHINA MAPPING
After finishing the data collection for assets and threats, Ramani Huria is teaming up with Data Zetu to focus on our next big goal: shinas. The shina (roughly translated to “branch” in Swahili) represents the most granular administrative divisions that exist in Tanzania. One key to mapping shinas are wajumbe, or shina leaders, who are the first point of contact for local households over issues such as public services, resource allocation and community challenges, such as theft etc.
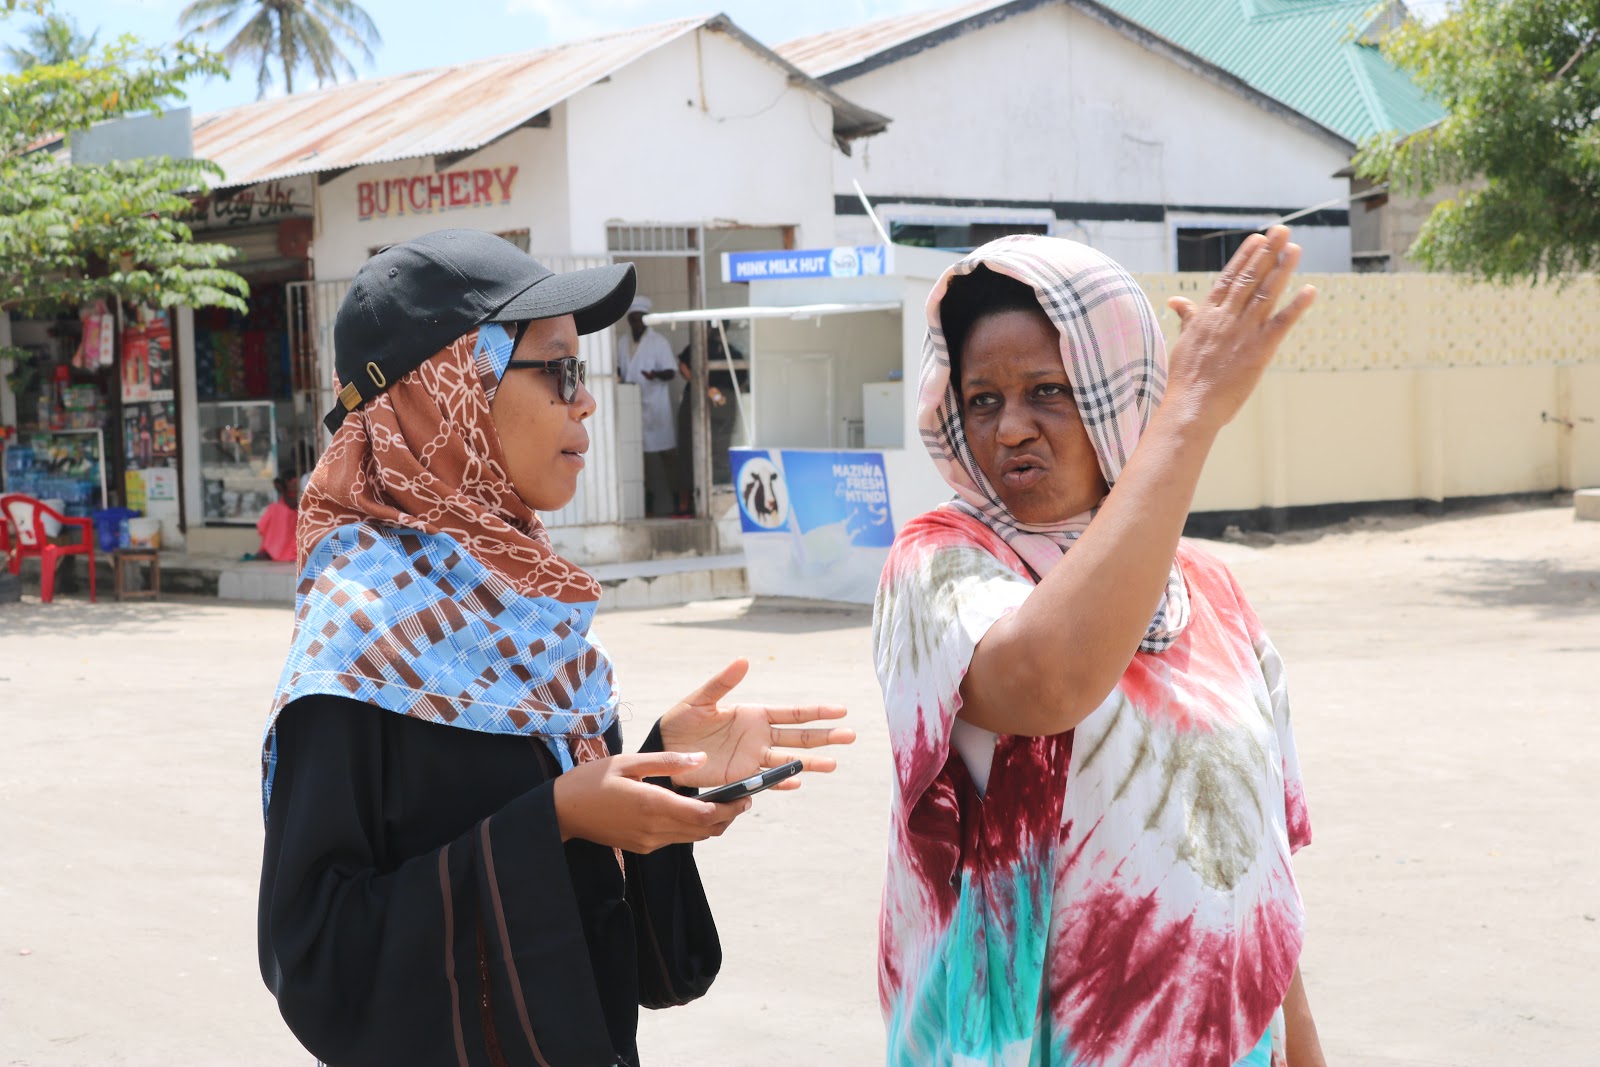
Shina Mjumbe at Tabata Subward in Tabata Ward giving direction to the student when tracing her shina boundary: Photo credit: Godfrey Kassano/Ramani Huria.
Wajumbe are chosen by their community to act as their liaison with the local government. These shinas were originally comprised of ten household clusters – 1 representative per 10 households – but due to increases in population and urbanization, these hyperlocal areas now contain between 30 and 150 households. Mapping shina boundaries will provide community members and service providers, such as emergency responders and public health experts, and efficient and more precise method to locate households at a smaller scale. Being able to locate themselves and other community members at the shina level reduce the amount of time it takes for services, such as emergency response, to reach households in the case of, for example, a flood or fire.
Look out for our next post to see final products for assets and threats throughout Dar es Salaam, as well as mapping progress on shinas!
WaSH is a collective term for water, sanitation and hygiene. While each is a separate field of work, they are interdependent in nature.
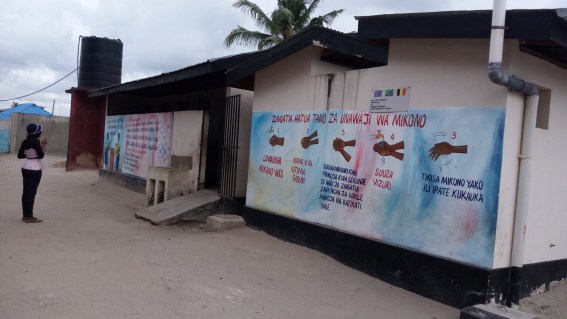
After flooding, communities are very vulnerable to outbreaks of disease such as cholera. Building off a foundation of ongoing response efforts for this in Dar es Salaam, Ramani Huria has started a rapid sanitation mapping campaign within the city’s wards, mainly focusing on public toilets.
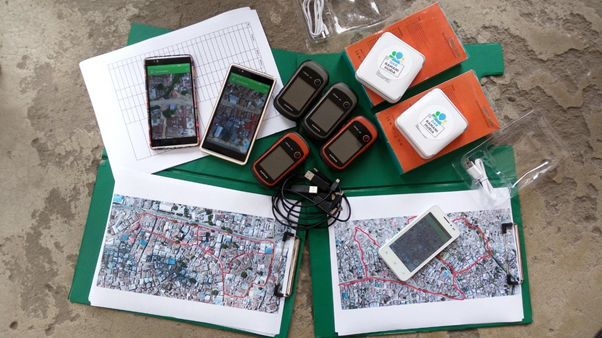
With the well-trained Ramani Huria team available, this is approached by dividing the team into two groups with two different methods of data collection but the same final output. This offers an opportunity to test which methods can best support the WaSH mapping. The methods used for data collection include:
The first method refers to a normal data collection method that involves producing fieldpapers for the site, grabbing a GPS unit and data collection forms, then heading to the site for data collection, while the second method involves installing phone apps that are equipped with data collection forms and imagery for data collection while in the field.
Data collection tools for WaSH mapping, SOURCE: Ramani Huria
Pre-field work
These are activities that are conducted before visiting the site for data collection. The following steps have to be followed before the actual mapping begins:
Preparation of the data model. The data model was developed from the OSM wiki page compiling the toilet tags that are applicable to Dar es Salaam’s situation.
Checking availability of imagery. Imagery, specifically that which has been produced by drones, is helpful in producing field papers for the areas where mapping is to be completed.
For OpenMapKit, data collection surveys using ODK are to be prepared, reflecting the data model that was developed. The surveys include questions that will be filled by mappers while making site visits to collect data.
For the group using GPS units, data collection forms are prepared and printed for mappers to fill while making site visits to collect data.
Producing and printing fieldpapers. The fieldpapers will guide mappers during site visit, showing boundary for the working area.
Last but not least, making official contacts with the ward’s local leaders is a critical activity to take place before mapping. This is done through official lettering.
Fieldwork
The first task is to check that each and every tool is properly working before heading out into the field. Making sure all smartphones are fully charged and power banks are brought out. After this, the fieldpapers are divided amongst mappers using both OMK and GPS units.
Setting mapping tools before WaSH mapping, SOURCE: Ramani Huria
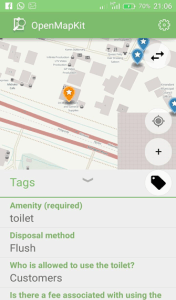
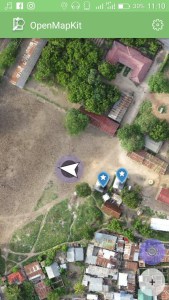
Splitting off for data collection. Every mapper must go to the area from which he/she is supposed to collect data. For both groups, the information collected during the process includes toilet disposal, either by flush/pit latrine/bucket or chemical, accessibility of the toilet, number of chambers per each toilet, who is responsible for the operating toilet, etc. After data collection, mappers return to the working space – most often a ward office.
Mapping in progress, SOURCE: Ramani Huria
OMK interface showing data needed for collection, location of a mapper, and mapped toilets.
OMK interface showing data needed for collection, location of a mapper, and mapped toilets.
Post-field work
The final step is to enter the data into the OSM platform where digitization using JOSM editor takes place. Both mappers using GPS units and OMK for data collection partake in this activity.
Data entry in the process, SOURCE: Ramani Huria
Comparison, working with OMK and GPS units
OMK is the best method for this task simply because it is the faster method of collecting data – offering mappers the ability to fill out ODK forms on a smartphone and showing mappers their location and imagery at the same time. The much more time-consuming method of using GPS/pen and paper requires that a mapper uses GPS to geolocate the area, a pre-produced fieldpaper to know the site, and a pen and paper for taking notes.
Additional pros
Loading Imagery – OMK can load imagery, eg. drone’s mbtiles, and can be used during site visit while GPS cannot – necessitating the pre-production of fieldpapers to aid mappers during site visit.
Accuracy – GPS accuracy may sometimes decrease due to cloud cover, leading to shifting the point of interest. This is not faced while working with OMK.
Time-saving – OMK saves time when working with JOSM editor, as tags for the toilets are added while filling in the ODK forms during the site visit. As a result, it only requires importing the data onto the computer and JOSM and then uploading it, unlike when the GPS/pen and paper method that requires mappers to manually digitize, add tags, then upload data. The latter is often a tedious process if a significant amount of data was collected.
Fun – It’s more fun working with OMK than GPS/paper method because it’s a smartphone app.
Cons:
Hasara
OMK consumes internet data when using online OpenStreetMap instead of imagery as a basemap background, unlike GPS units that do not have a need for internet as they use satellites to geolocate.
OMK inatumia kifurushi cha mtandao wakati wa kutumia OpenStreetMap kwa mtandao, badala ya picha kama picha ya nyuma, tofauti na vifaa vya GPS haiitaji kifurushi cha mtandao, ambapo inatumia sattelite kuonyesha maeneo.
OMK consumes a phone’s battery while working, unlike GPS units. However, this problem has been addressed by using power banks to charge phones while working.
OMK inatumia betri ya simu wakati wa kufanya kazi, tofauti na kifaa cha GPS, Hatahivyo tatizo hili limeshughulikiwa kwa kutumia kifaa cha kutunzia umeme kuichaji simu wakati ikitumika.
Each year, 5th June marks World Environment Day, a day for raising global awareness to take positive environmental action to protect nature and the planet Earth. This year’s Sunday 5th June saw UWABA (Umma wa Wapanda Baiskeli; or “Public Cycling Community”), a cycling community in Dar es Salaam in cooperation with European Union, organizing the cycling caravan. This is to support low carbon transport, to promote environmental alternatives to high carbon transport as well as putting emphasis on the presence (or absence) of bicycle roads/routes in the city.
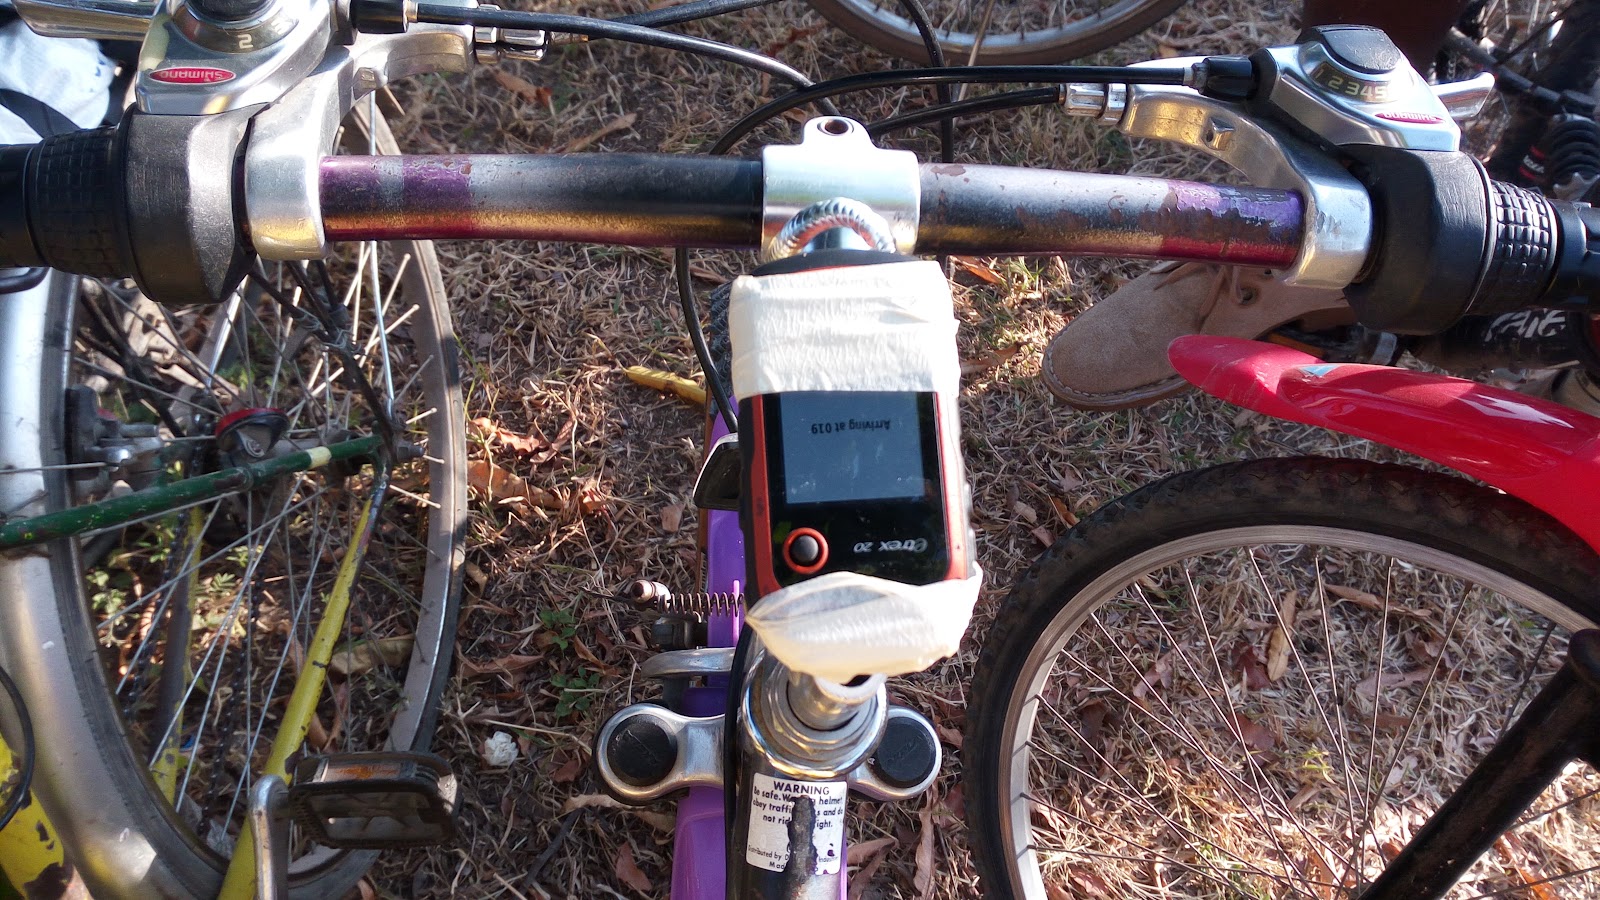
With the motivation to do the mapping for the city, Ramani Huria fully participated to support the initiatives by UWABA community and map the possible bicycle routes around the city. This was done by tracking the caravan’s route with the use of GPS units tied on the bicycle.
GPS attached to a bicycle
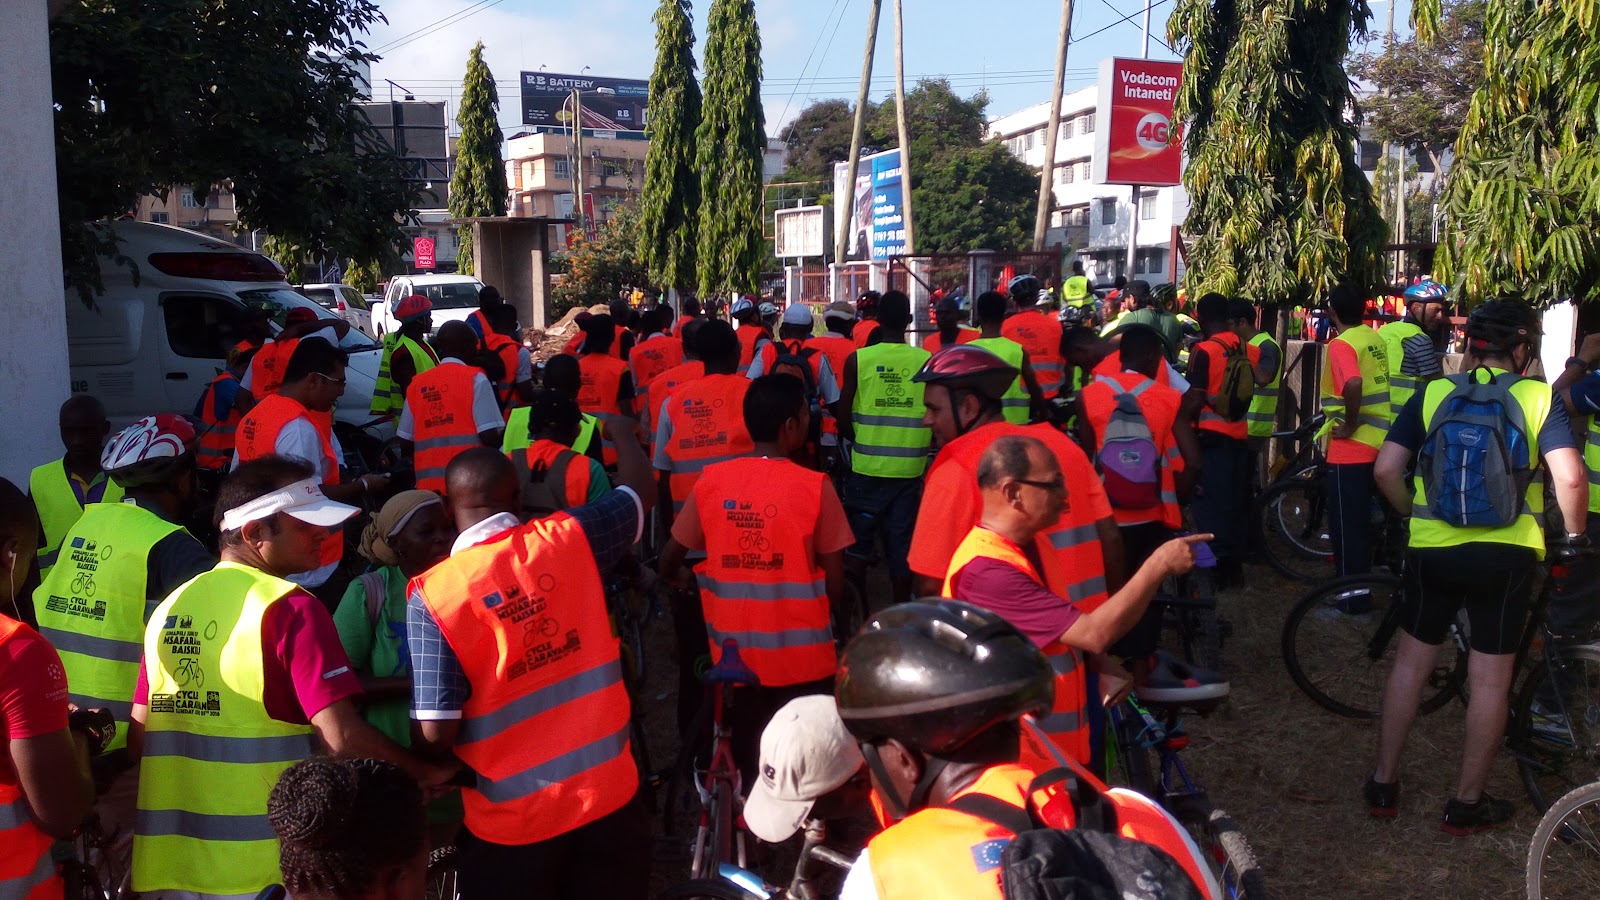
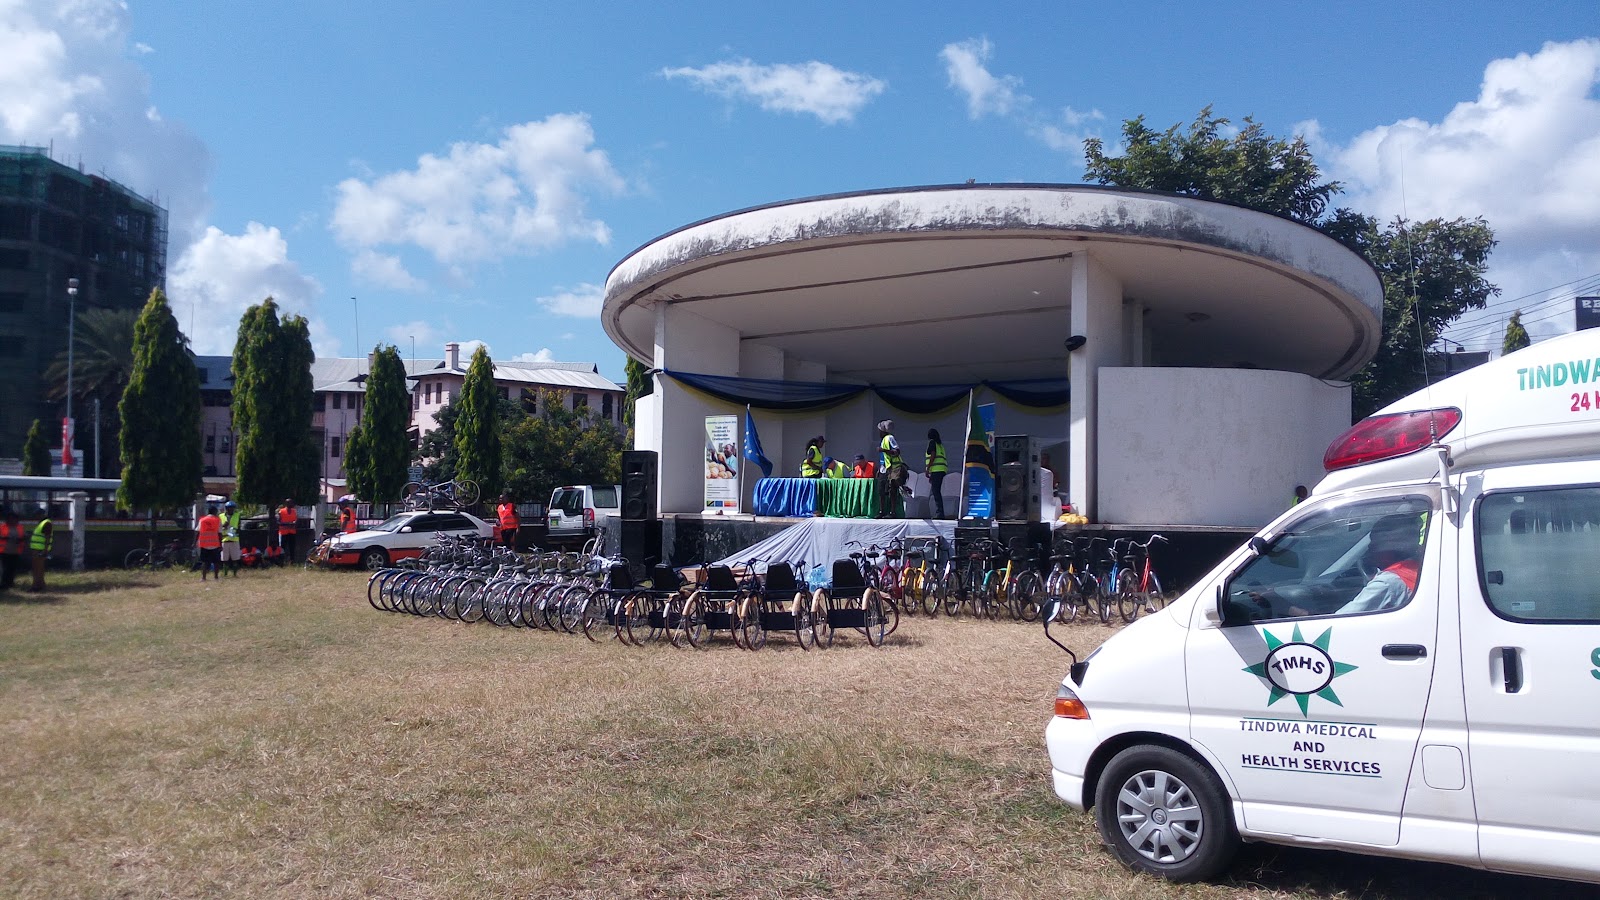
The event was scheduled to start at 7 AM at the Mnazi Mmoja grounds with the registration of the participants, provision of free reflector jackets, bicycle helmets and bicycle reflectors to all participants.
Participants with their reflector jackets on.
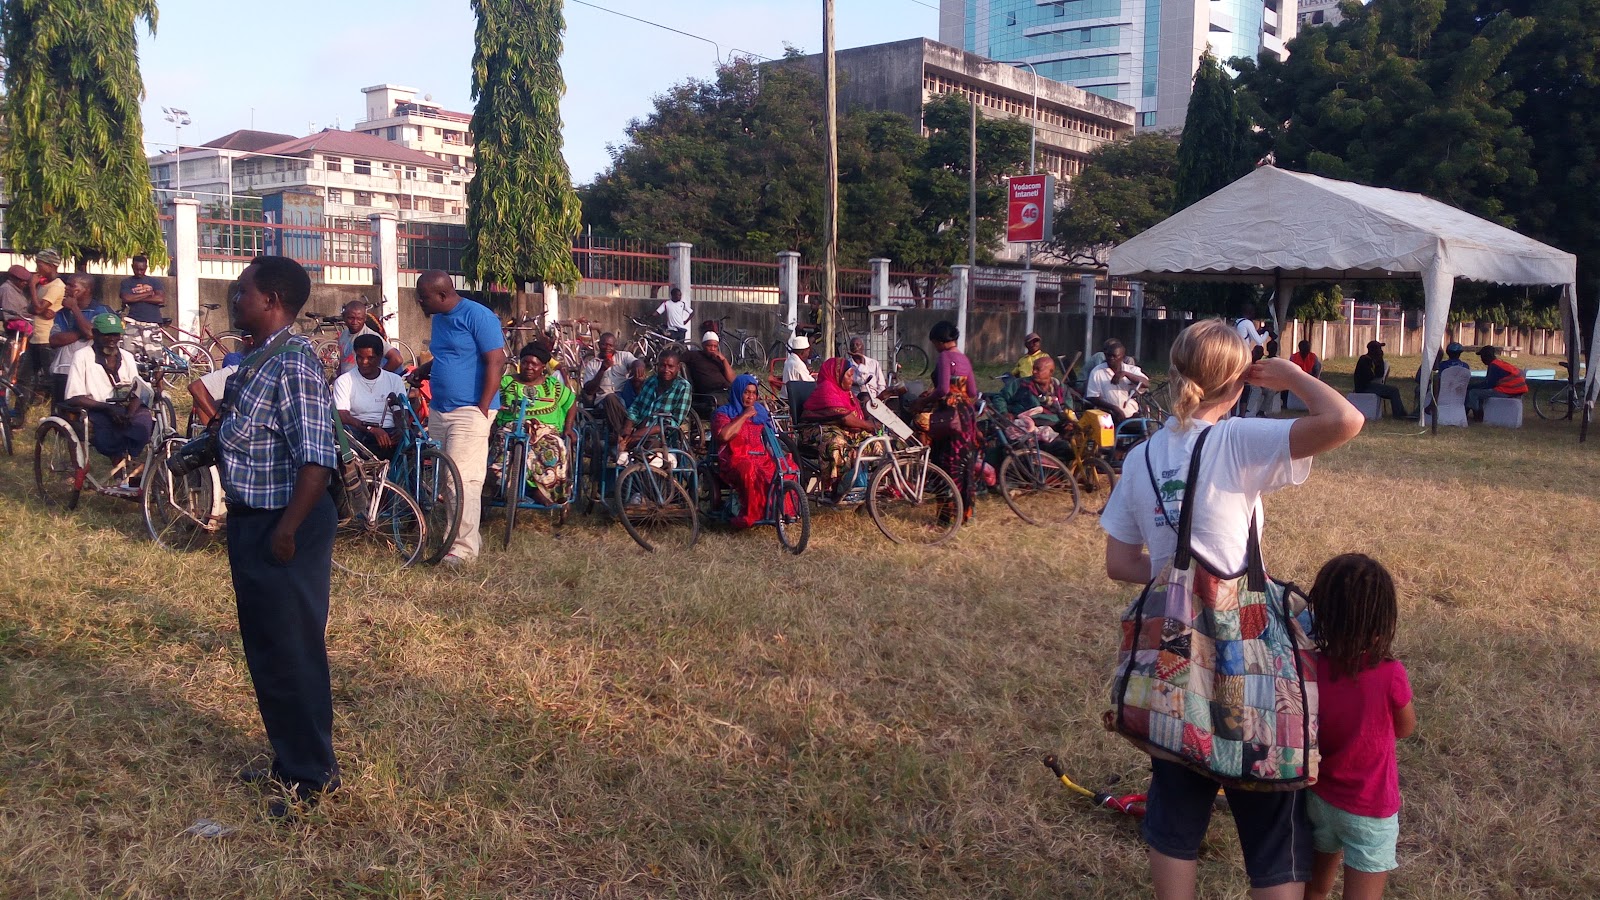
Most of the attendees for the event ranged from disabled people with hand bikes and abled people including women, children and men with the coverage of different media sources.
Disabled participants in the back
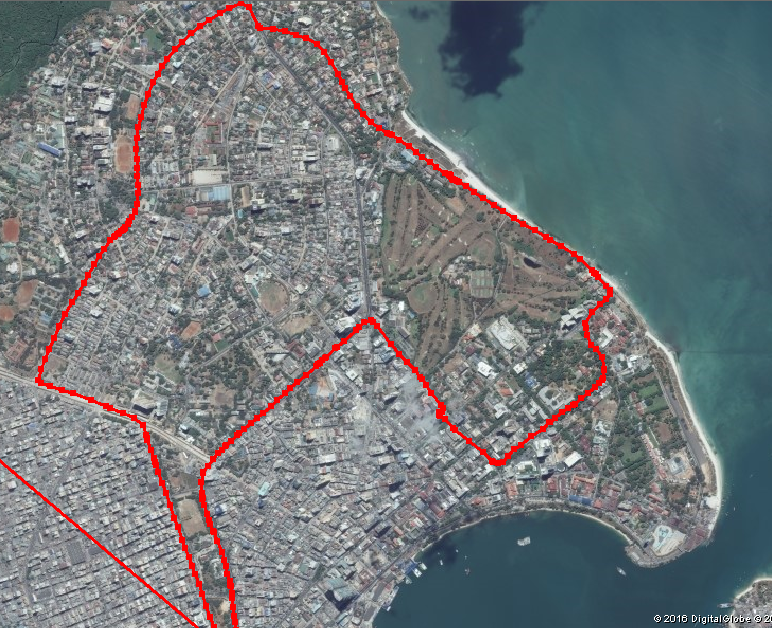
After all, attendee arrives, including January Yusuph Makamba, a minister of State in the Vice President’s Office for Union Affairs and Environment, the caravan started at 08:45 AM. The route went along Bibi Titi road, Ohio Street, Sokoine Driveway, Chimara Street, Barack Obama Drive to Agha Khan Hospital, where people had a short break to catch their breath. After that, the caravan continued to Selander Bridge and took the United Nations Road to Morogoro Road (Fire Squad Headquarters), followed the Morogoro Road and caught Lumumba road back to Mnazi Mmoja.
Throughout the process, the routes used for the caravan were basically not only meant for cycling purposes but rather, they were roads for general uses such as cars, motorcycles etc. With the escort and support from traffic police, cars within the major roads were blocked leaving a clear way for the caravan to go through. This isn’t an everyday occurrence, with cyclists usually competing for space with traffic.
The caravan’s route around the city centre.
Back at Mnazi Mmoja, while attendees had snacks and water to eat and drink, Mr. Mejah Mbuya, chairperson for UWABA gave a short speech on the importance of using bicycles as low carbon transport around the city. With the fact that Dar es Salaam is much affected by traffic jams, Mr. Mbuya emphasized on the use of bicycles to minimize it.
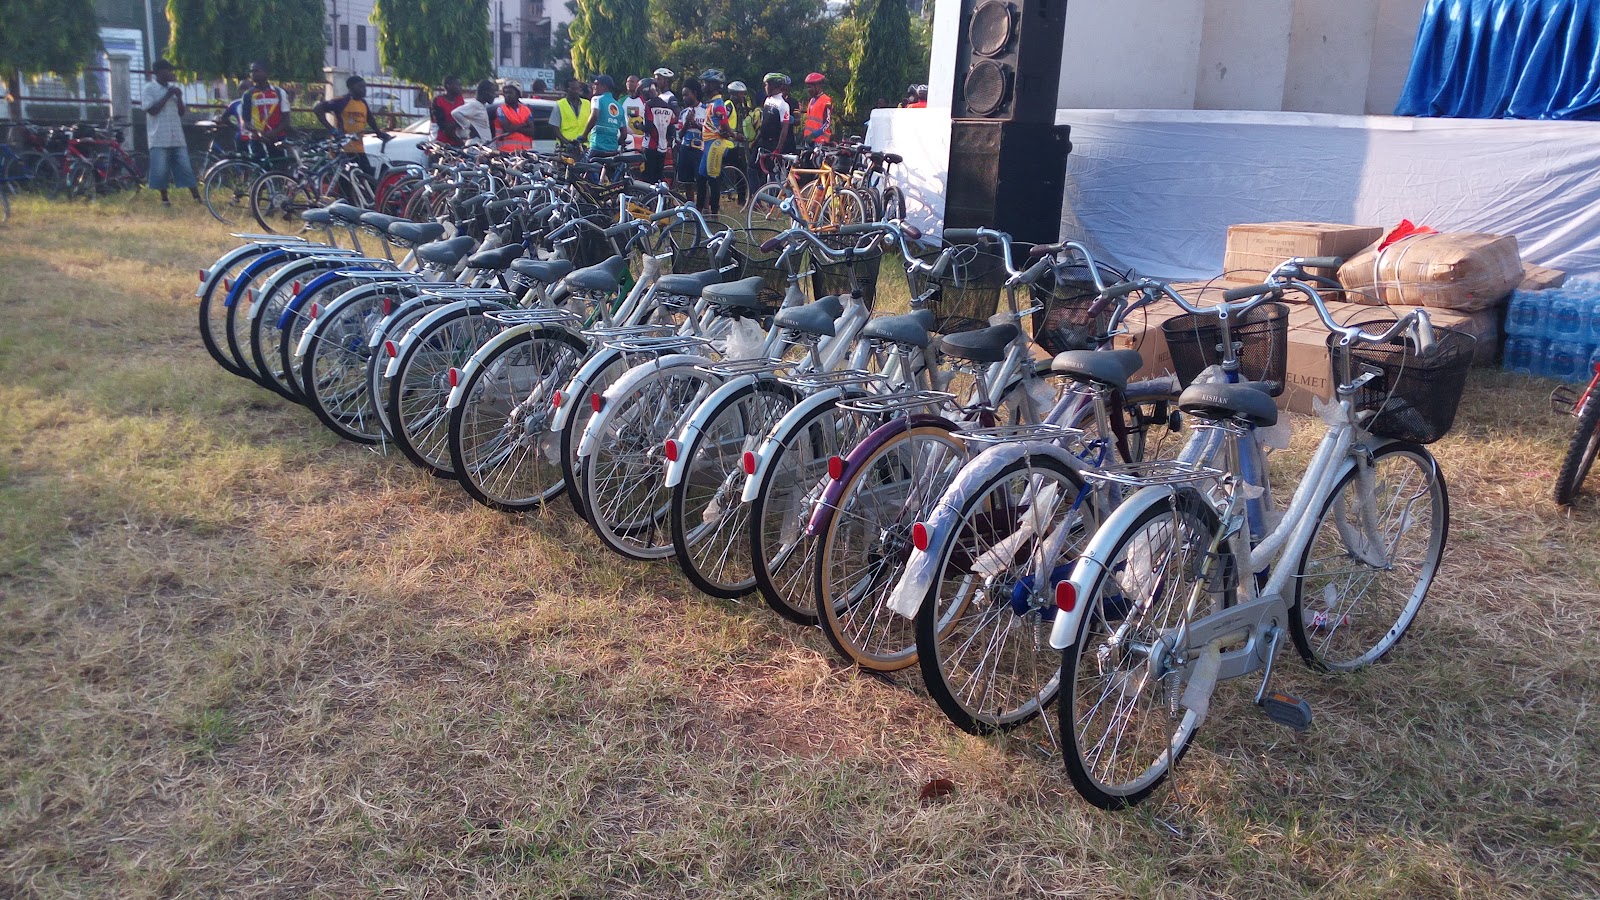
At the end of the event, 5 hand bikes to 5 lucky disabled people, and 15 bicycles were awarded to 15 people who attended the caravan. Unfortunately, no attendee from Ramani Huria team won any bicycle, but did have fun while mapping!
15 bikes for winners
Ramani Huria is looking forward to joining forces with UWABA in mapping and promoting low carbon transport i.e bicycle usage throughout Dar es Salaam.
*Guest post by Kathryn Davis, Columbia University*
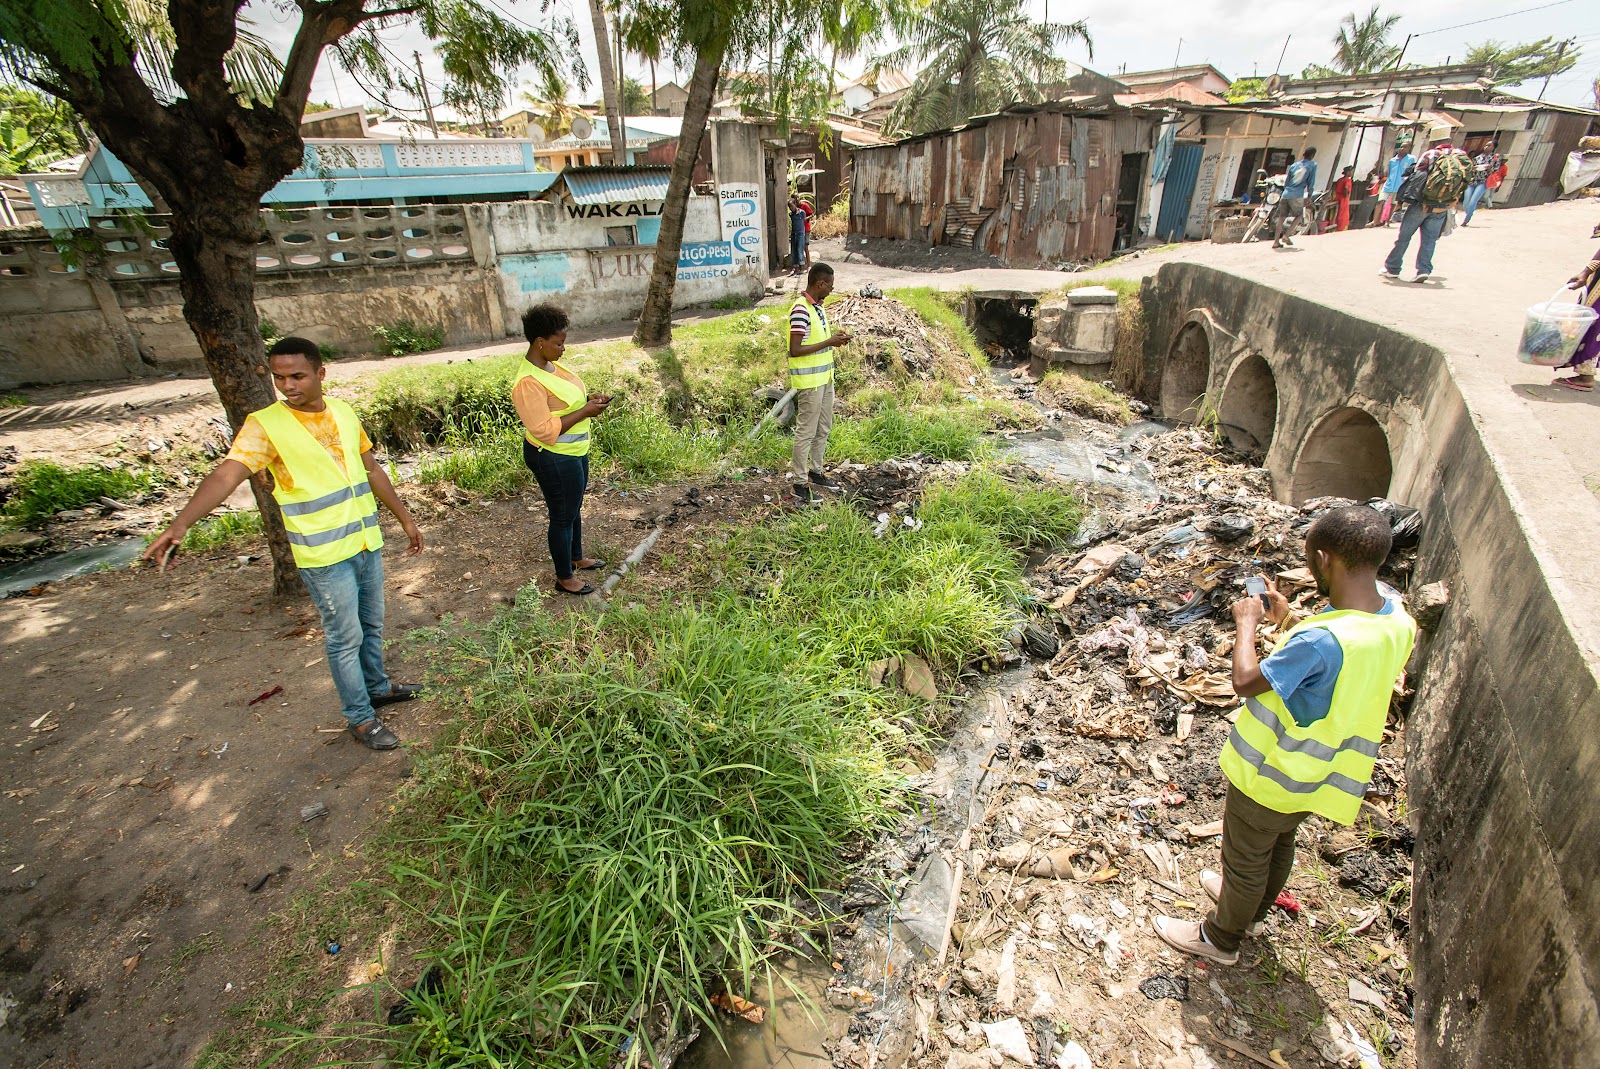
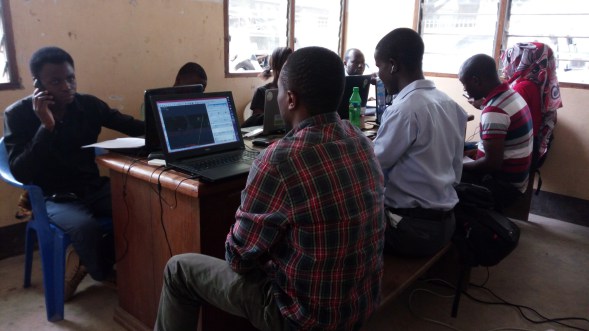
January 14th, 10:30 am. We arrive in Chang’ombe ward (an industrial area in Dar es Salaam) after weaving in and out of traffic in the project bajaj (rickshaw) through different neighbourhoods. Johannes Peter, a seasoned mapper with the Dar Ramani Huria project, takes another look at his drone imagery printout of the area and indicates that we’ve arrived at our starting point. He starts the OSMTracker app on his phone, ready to start work (the tracker app helps him to geolocate, and take pictures of interesting areas, with the pictures tagged to a GPS location). Mappers like Johannes detail key drainage and water infrastructure that hasn’t been digitized before and that can be used for disaster risk reduction planning and flood resilience. He stops to check the map again, and then we’re off looking for drainage systems (our main task for the day). Carolina and I (two Columbia University graduate students, here on a preliminary trip to evaluate the project) are tagging along on a regular day for the Dar Ramani Huria project, to see the work team members are doing in the field. It’s not easy work, but essential to the project.
Almost immediately, we see drainage on the right side of the wide dirt road and mark it on the map. Johannes quickly identifies where we are on the map, and starts using the OSM Tracker App to identify the drainage, and to note indications of garbage or other debris blocking it. He uses his phone to photograph this: the Tracker App automatically geotags the image, to give a visual for other OSM map users. All the data that Johannes collects today will be “digitized” (added to the online map) later, so it’s crucial to get details right, and we spend time noting each part of the drainage system that we can see, including the direction of water flow, which might indicate a drainage convergence at that point, or where drainage ends abruptly with no continuation. Johannes is systematic in his mapping: we cross part of the outer perimeter of the ward, then move down inner roads, stopping each time to note important drainage details.
By now we’re halfway through and the midday sun is shining on us, but with a quick water break we’re off again, to finish the area we’ve been assigned for the day. We see drainage under construction: Johannes indicates that on the map too, as drainage on these roads is likely to change in the coming weeks. We also see that part of one of the roads is flooded after light rain the day before. Drainage can go underground, or we may need to figure out where the road is from the map: walking these roads and mapping takes a person who is comfortable asking questions, and Johannes, who’s from the city, is always ready to ask people in the neighbourhood he’s mapping for help, whether it’s for directions or the name of someone who might know where the non-visible drainage lines go.
After a day in the field, Johannes brings the now annotated maps to BUNI Innovation Hub to digitize. BUNI which is where the HOT team works from in Dar es Salaam when they are not in the field mapping. At this phase in the project, mappers typically work two days in the field, then one day digitizing their field data into the OSM platform. The 22 mappers currently on the project (most of whom have been there since the initial mapping in early 2015), have mapped many wards in the city of Dar es Salaam. The project was completed in detail infrastructure of 21 wards in Dar es Salaam and is now finishing a review of the drainage in these wards, and mapping 32 additional wards.
As we’re pulling away in the bajaj at the end of the day, we asked Johannes about using the data, mapping and being part of the project. He told us that “we are the Humanitarian OpenStreetMap Team. Humanitarian means that we are taking care of people, and this means that some things we have to do voluntarily”. Most of the main mappers (including Johannes) have recently obtained university degrees in urban planning or geography, and are extremely passionate about their work. When he visited the Katavi Region in the southern part of Tanzania to visit family, he saw there were no maps, so he started mapping the area using the skills from he learned from the project. For Johannes, mapping isn’t just what he does at work with the Dar Ramani Project. It’s also something he does in his free time.
Vingunguti is an administrative ward in Ilala district in western Dar Es Salaam and according to the 2012 census has a population of 106,946. Vingunguti ward is a flood-prone area of Dar es Salaam and many settlements within it are informal. The Msimbazi River flows around the West and North boundary of the ward, and during the rainy season is a major cause of flooding.
Launching mapping in Vingunguti
Ramani Huria launched mapping in Vingunguti with a community forum taking place on 11th September 2015. Red Cross volunteers were excited to be present at the event, with the Ward Community Executive Officer Mr Msimi, and community members from eight sub-wards, including Mtambani, Kombo, Mtakuja, and Miembeni. Also in attendance were representatives from the World Bank, Humanitarian OpenStreetMap, and university students from Ardhi University and the University of Dar es Salaam.
Vingunguti ward before mapping SOURCE: OpenStreetMap
Vingunguti ward includes many flood-prone areas and Red Cross volunteers shared their experiences of flooding in the ward during 2011 and 2015. One story shared by Mzeee Hamis was that in 2015, floods led to the death of five people and buildings within the ward were so heavily flooded they have been abandoned. He noted that due to financial resources current initiatives against flooding are severely limited. Mr Said Mwikala also shared his experiences, noting that on the 4th of April Vingunguti hospital was completely flooded, with drains overflowing and offices and wards of the hospital being severely affected. As a result, in one case, a pregnant woman had to deliver outside the labour room as it inaccessible and full of water. Ambulances were unable to bring the sick to the hospital, and the facilities were not functional for more than twelve hours. He noted that the flooding in April of this year was disastrous, with high costs to property and loss of life.
Mapping Vingunguti
Assisting in the mapping of Vingunguti by Ramani Huria, the Red Cross volunteer group divided into two groups, each with ten volunteers, and each group worked with other community members and students involved in the mapping of the ward. The first group were active from 14th September to 18th September, and in collaboration with experienced student mappers, began data collection with GPS units. The second group were active from 21st September to 25th September.
While many residents were enthusiastic and supportive of the mapping project, the Red Cross volunteer teams did encounter some challenges. Power shortages made it difficult to digitalise the collected information in a timely manner and the changes in the availability of the room supplied by the ward office meant that activities had to occasionally relocate to the nearby Kombo Primary School.
While some challenges were faced in mapping, the students, community members, and Red Cross volunteer all worked hard to complete mapping of the ward on time. Over two weeks the Ramani Huria team, including Red Cross volunteers, mapped the entire ward, including sub-wards of Kombo; Mji Mpya; Faru, Mtambani; Mtakuja; Butiama; Miembeni; and Majengo. Key features such as roads, buildings, drainage channels, and flood-prone areas, were all included in the mapping.
Completing mapping in Vingunguti
Vingunguti ward after mapping
Mapping was completed in the ward and closed with a community forum on the 9th of October. Maps were presented at the ward, a general map and drainage specific map, and those participating in the mapping received certificates of achievement.
Maps presented in Vingunguti ward PHOTO CREDIT: Ramani Huria
The maps were presented to the Ward Executive Officer, Mr Msimi, to provide Vingunguti ward with the tools to enable improved disaster planning and response to flooding.